100% tevredenheidsgarantie Direct beschikbaar na betaling Zowel online als in PDF Je zit nergens aan vast
logo-home
Summary Research in Biomedical Sciences €9,49
In winkelwagen

Samenvatting

Summary Research in Biomedical Sciences

 14 keer bekeken  1 keer verkocht

Research in Biomedical Sciences notes directly from the lectures and course material, integration with laboratory practicals and workgroups.

Voorbeeld 4 van de 31  pagina's

  • 3 februari 2024
  • 31
  • 2023/2024
  • Samenvatting
  • rbms
Alle documenten voor dit vak (7)
avatar-seller
ssarto
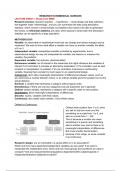
RESEARCH IN BIOMEDICAL SCIENCES
LECTURE VIDEO 1: Recap from IBMS
Research process: research question → hypotheses → study design and data collection,
that together make ‘methodology’, and you can summarize the data using descriptive
statistics, which concern a small sample, but statistics also wants to be able to generalize
the results, so inferential statistics are used, which assess to what extent the descriptive
statistics can be applied to a large population.

METHODOLOGY:
Variable: an observable or hypothetical event that can change and whose changes can be
measured. We want to know what effect a variable can have on another variable, the effect
of X on Y.
Independent variable: manipulated variable controlled by experimenter, and in
observational design we may not manipulate the variable, but observe or measure the
variable, the predictor.
Dependent variable: the outcome, observed effect.
Extraneous variable: not of interest to the researcher but might infòuence the variables of
interest if not controlled, it provides an alternative explanation. If it’s controlled, such as kept
constant or manipulated, no problem; if it’s not controlled, it becomes a confounding
variable. Keeping them constant is much easier in an experimental design.
Categorical: don’t allow meaningful interpretation of differences between values, such as
you cannot put a number between colors, or an ordinal variable gives the position but not the
actual distance.
Nominal: a variable that represents a category without logical order.
Dichotomous: if there are only two categories (not just presented, but in general).
Ordinal: ranked variable, represents a category with a specific order or rank position.
Quantitative: allow meaningful interpretation of differences.
Discrete: counts, variables with finite values.
Continuous: also called scale variable, it has infinite values.

Ordinal vs Continuous:
Ordinal when position from 1 to 5, when
you ask to say how much you like
something on a scale from 1 to 5, and
also on a scale from 1 - 100.
This is because a number can mean
something to a person and something
else to another one, and so there is no
meaningful interpretation of differences.
But it has a better discrimination
because of the range, so some consider
it as continuous.

Research design: are we interested in a causal effect or in an association?
Which and how many dependent/independent variables are we using? If we want to
manipulate the independent ones, which and how many groups and conditions we want to
compare? And are measurements/manipulations dependent/within-subjects/paired or
independent/between-subjects/not paired?

,Dependent/within-subjects design: every participant is exposed to all the levels of
conditions, and the differences are measured within every participant.
Independent/between-subjects design: each participant is exposed to either one or the
other condition, not both, only one level of the independent variable.
Observational: no manipulation.
Cross-sectional: all measurements happen at the same time.
Case control: you measure the outcome at a current time and you go back in time to find
possible predictors that were measured in the past.
Cohort: you measure the variable at one point in time and you follow the sample for a
certain period and you assess them a second time again.
Experimental: manipulation, only when you compare an experimental condition to a control
condition. Some kind of randomization process takes place.
Randomized control design: treatments are randomly assigned to two or more groups,
and in this way you compare variables by comparing groups, between.
Cross-over design: participants are randomly assigned to an order of two or more
conditions /with wash up periods), meaning that all participants undergo all conditions,
within.
It’s the type of design that decides whether or not you can have a causal conclusion. If you
use an observational design, there is no way you can have causality, while if you use an
experimental design, you can have causality if the randomization was okay, no bias etc.

Representative sample: we cannot study a
population, so we need a sample, which is a
subset of the population, the limited group in
which we observe data, and to make it
representative it contains all members of a
defined group to which we aim to generalize
our conclusions.


DESCRIPTIVE STATISTICS:
The goal is to present, organize, summarize data observed in the sample, and you can use
different measures:
Frequency: frequency and proportions. Frequency is the quantification of how often each
value in the data set occurs, and Proportion is the quantification of how often each value in
the data set occurs in proportion to other values (f/tot).
Central tendency: mean, median, mode. Mean is the average value, calculated taking the
sum of each value divided by the total number of values. Median is the value in the middle
location and if you have an even number the median is the mean of the two centrals. Mode
is the most frequently occurring value. No mode, bimode, or normal mode.
The mean is used with quantitative data, because it takes into account the exact distances
between values, making it a powerful statistic to estimate population parameters and in
inferential statistics, but it’s very sensitive to outliers, the extreme values.
The median is used with ordinal data, because it takes into account only the position of
ranked values and is so unaffected by outliers.
The mode is used with nominal data because it doesn't take into account exact distances
between values or rank order,it’s unaffected by outliers and uninformative in small data sets.

,Dispersion/variability: range, interquartile range, and standard deviation, which measures
the distance from the central or typical value.
The Range is the difference between the highest and lowest scores of the sample.
The Interquartile Range is the distance between the two values that cut off the bottom 25%
of values (Q1, median of the values below the median) and the top 25% of values (Q3,
median of the values above the median).
Variance is an estimate of the average amount by which the scores in the sample deviate
from the mean score. It’s the sum of the square differences between each individual point
from the mean divided by the total number of values minus 1.
The standard deviation is an estimate of the average amount by which the scores in the
sample deviate from the mean score. It’s the square root of the variance.
The range is the simplest and most rude measure, is sensitive to outliers and
unrepresentative of any features of the distribution of values between the extremes.
The IQR is unaffected by outliers and the most useful measure for ordinal-level data.
The SD and variance take into account all values, are the most sensitive measures of
dispersion, but also sensitive to outliers, are measures of dispersion around the mean, the
most useful measure for quantitative data, and powerful statistics used in estimating
population parameters and in inferential statistics.
Graphs and figures:
Pie charts are used to show frequency and proportions.
Dot plots are again useful for small data sets and show the frequency.
Histograms also show frequency and are convenient for large data sets, on the x axis the
variables and on the y axis the frequency.
Bar charts are used for the mean and the SD, in which the bars represent the means and
the whiskers represent the SDs.
Box plots are used for the median and IQR, for ordinal and quantitative variables, the
median is represented by the middle line, the lowest edge of the box is Q1 and the highest is
Q3, the lowest end of the whisker represents minimum and the highest the maximum.

INFERENTIAL STATISTICS: the goal of a research is to draw conclusions about a
population based on data observed in a sample, so you need inferences from the sample to
the population. You can do that by using statistical tests that are based on probability
distributions and measures of uncertainty.
PROBABILITY: how likely an event is to occur, the proportion of times an outcome will
occur.
Complement rule: the probability of an event occurring and not occurring is 1.
Specific multiplication rule for independent events: the probability of two events
occurring is the product of the two probabilities.
General multiplication rule: the probability of two events occurring is the probability of one
event occurring times the probability of the second event occurring given that the first one
occurs.
How likely are we to observe the data we observed in our sample if our hypothesis is true?
The probability of our data given that our hypothesis is true.

, LECTURE VIDEO 2: PROBABILITY MODELS
To answer the RQ we need to make a study design and collect data and then ask, how do
these data come about and what is the process underlying these data?
Then to make inferences we need probability models.
Probability models or distributions: are used to describe distributions of random events,
and they describe all possible outcomes of the random event, which is when individual
outcomes are uncertain yet there is a regular distribution of outcomes in a large number of
repetitions, and the probability of a random event is the proportion of times the outcome
would occur in a long series of repetitions.
Empirical prob distributions are based on empirical data from our sample, whereas
theoretical prob distributions are predicted or hypothetical distributions of our population, a
distribution we expect to occur when we look at our population.
Two key characteristics of probability distribution:
Expected value: the average outcome of the random event X (E(X) or mu). We calculate it
by multiplying every possible outcome with the probability of that outcome and summing all
these multiplications across all possible outcomes.
The expected value of winning tickets is 6 euros, but people buy them because of the large
variance, so because there is a small chance of winning 100 ‘000 euros.
Variance: measure of the dispersion or spread of the outcomes of the random event X
(var(X) or square sigma). To calculate it, for every possible outcome we calculate the
difference with expected value, then take the square of this difference, multiply with the
probability of the outcome, and then sum all multiplications.

Binomial distribution: the distribution of the probabilities of all possible numbers of
successes for repeated trials of independent, dichotomous events with a specific
probability of success. Dichotomous events have two potential outcomes, success with a
value of 1 (pi greco) and no success with a value of 0 (1-pi greco). We can calculate the
number of successes for a certain number of repeated independent trials.
The binomial coefficient shows how many orders can the participants come.
The product rule for the independent probabilities is the multiplication of each probability of
each participant given the number of participants who have success and the ones that have
no success. The repeated trials are assumed to be independent.

Voordelen van het kopen van samenvattingen bij Stuvia op een rij:

Verzekerd van kwaliteit door reviews

Verzekerd van kwaliteit door reviews

Stuvia-klanten hebben meer dan 700.000 samenvattingen beoordeeld. Zo weet je zeker dat je de beste documenten koopt!

Snel en makkelijk kopen

Snel en makkelijk kopen

Je betaalt supersnel en eenmalig met iDeal, creditcard of Stuvia-tegoed voor de samenvatting. Zonder lidmaatschap.

Focus op de essentie

Focus op de essentie

Samenvattingen worden geschreven voor en door anderen. Daarom zijn de samenvattingen altijd betrouwbaar en actueel. Zo kom je snel tot de kern!

Veelgestelde vragen

Wat krijg ik als ik dit document koop?

Je krijgt een PDF, die direct beschikbaar is na je aankoop. Het gekochte document is altijd, overal en oneindig toegankelijk via je profiel.

Tevredenheidsgarantie: hoe werkt dat?

Onze tevredenheidsgarantie zorgt ervoor dat je altijd een studiedocument vindt dat goed bij je past. Je vult een formulier in en onze klantenservice regelt de rest.

Van wie koop ik deze samenvatting?

Stuvia is een marktplaats, je koop dit document dus niet van ons, maar van verkoper ssarto. Stuvia faciliteert de betaling aan de verkoper.

Zit ik meteen vast aan een abonnement?

Nee, je koopt alleen deze samenvatting voor €9,49. Je zit daarna nergens aan vast.

Is Stuvia te vertrouwen?

4,6 sterren op Google & Trustpilot (+1000 reviews)

Afgelopen 30 dagen zijn er 48756 samenvattingen verkocht

Opgericht in 2010, al 15 jaar dé plek om samenvattingen te kopen

Start met verkopen
€9,49  1x  verkocht
  • (0)
In winkelwagen
Toegevoegd