Notes on the live lectures for the course Introduction to Statistics. Contains explanations and solutions for the problems presented during the lectures. Covers important exercises which are likely to come up on the exam.
STATISTICS – LECTURE NOTES
CHAPTER 1 & 2
֎ why do we need statistics?
- to see the real data and analyze them in order to come to conclusions about some
concepts
- to handle and interpret data so that we can gain knowledge from them
- intuition evidence-based decision making
- to help with making well-informed decision
- we are bombarded with statistics everywhere and we need to make sense out of these
numbers and statistics is the only way to make sense of these figures
- the statistics is fundamentally about uncertainty
- difference between mathematics and statistics: statistics are about things which cannot
be fully calculated, mathematics are more concrete
- sampling: core part of statistics
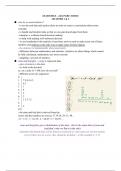
֎ stem and leaf plot – a way to represent data
- gives structure to the data
- we look at the decimal
ex. on a scale of 1-100, how do you feel?
- different scores are organized
0
1 798845
2 92
3 1
4 8
5 3
6 2
7 13572
8
9 2
10
- the stem and leaf plot is derived from the
scores and the numbers are seen as 17,19,18, 29, 31, 48…
- 0 = 1-9 ; 1 = 10-19 ; 2 = 20-29 ; 3 = 30-39 …
stem and leaf plots give a distribution of the data – that is the main idea of stem and
leaf (that’s why we flip it to the side)
uniformly distributed data will be falsely presented if we omit some sets of observations
(even if there are no scores, they should be included – in this example 3, 4 ,5)
,֎ N – population ; n –sample
֎ the inferences we make are about a hypothetical population (people who live, who are
about to be born, who have lived) ; the entire population cannot be tested
- this is why we always use sampling
- conclusions are based on sample statistics
֎ example: how often have you moved house?
we have data responses data responses
- we build a frequency table – we have values, which are the reported scores
X – all the options people could give
f – frequency of the answers
what is the percentile rank of having moved 4 times = 75% (looking at the cumulative %)
- if you have moved more than 4 times, you have moved more often than 75% of the
population
֎ height in cm – a midpoint of an interval
ex. 180 cm – corresponds to an interval (has lower and upper limits)
- there could be multiple values which fir into this interval
, the next decimal place determines the intervals
֎ question 2.10
X f cumulative %
20-24 2 100
15-19 3 90
10-14 3 75
5-9 10 60
0-4 2 10
what is the cumulative percentile rank for the value of X = 9.0?
we are talking about intervals so we are talking about the intervals of 0-4/ 5-9
X c%
5-9 60
-the upper real limit is 9.5
0-4 10
- the upper real limit is 4.5
first step: how many points do we need to go down from 9.5 to reach 9?
answer: 0.5
the whole interval has a size of 5
we create a fraction = 0.5/5 = 0.1 (point of
interest)
we need to go 0.1 = 10% down to reach 9
50 x 0.1 = 5
60 – 5 = 55%
therefore, the value of 9 corresponds to 55%
percentile rank
50 is the size of the interval of cumulative
percentages
CHAPTERS 3 & 4
central tendency of data – expresses info about the average of the data
variability (spread of data)
data as distributions
- histogram – expresses the frequency and scores
Voordelen van het kopen van samenvattingen bij Stuvia op een rij:
Verzekerd van kwaliteit door reviews
Stuvia-klanten hebben meer dan 700.000 samenvattingen beoordeeld. Zo weet je zeker dat je de beste documenten koopt!
Snel en makkelijk kopen
Je betaalt supersnel en eenmalig met iDeal, creditcard of Stuvia-tegoed voor de samenvatting. Zonder lidmaatschap.
Focus op de essentie
Samenvattingen worden geschreven voor en door anderen. Daarom zijn de samenvattingen altijd betrouwbaar en actueel. Zo kom je snel tot de kern!
Veelgestelde vragen
Wat krijg ik als ik dit document koop?
Je krijgt een PDF, die direct beschikbaar is na je aankoop. Het gekochte document is altijd, overal en oneindig toegankelijk via je profiel.
Tevredenheidsgarantie: hoe werkt dat?
Onze tevredenheidsgarantie zorgt ervoor dat je altijd een studiedocument vindt dat goed bij je past. Je vult een formulier in en onze klantenservice regelt de rest.
Van wie koop ik deze samenvatting?
Stuvia is een marktplaats, je koop dit document dus niet van ons, maar van verkoper anniedeshkova. Stuvia faciliteert de betaling aan de verkoper.
Zit ik meteen vast aan een abonnement?
Nee, je koopt alleen deze samenvatting voor €5,19. Je zit daarna nergens aan vast.