Summary: Health Economics EBB120A05, Rijksuniversiteit Groningen 2018/19
Chapter 1: Why Health Economics?
In 1960, every 1/20 dollars (= 5%) spent in the US went towards health care. In 2006, this was 1/6 (=
17%). This trend has been similar in other countries, although no one spends quite as much on health
care as Americans.
For many years, economists did not treat health economics differently at all, but in 1963 Stanford
professor Kenneth Arrow did (Uncertainty and the Welfare Economics of Medical Care, Arrow 1963)
and established health economics as its own field of study. Arrow argued that health is different from
other goods for one major reason: uncertainty. Unlike other markets, the demand for health is highly
uncertain.
Chapter 2: Demand for health care
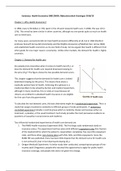
Are people price-insensitive when it comes to health care (𝐷𝐼 ), or
does the demand for health care respond downward-sloping to
the price (𝐷𝐸 )? The figure shows the two possible demand curves.
This chapter suggests that the demand for health care is indeed
downward-sloping (to the price). This means there exists a
medically optimal level of health. Achieving this optimum is a
medical problem to be solved by doctors and medical researchers,
although in many countries, this is rarely an issue because all
citizens are entitled to subsidized health insurance or are eligible
for free care from the government.
To calculate the real demand curve, the best alternative might be a randomized experiment. This is a
study that assigns treatments randomly to different groups of study participants. A randomizes
controlled experiment includes a control group which is randomly chosen and receives either no
treatment, a placebo, or the usual treatment. Such study provides the most persuasive evidence on
questions of causality in social science and medicine.
Two influential randomized experiments of health care demand are:
1. The RAND Health Insurance Experiment (HIE): The first large-scale randomized study on
insurance status. The experiment had four plans with different copayment rates (the fraction
of the medical bill for which the patient is responsible): completely free care (0% copayment
rate), and three other cost-sharing plans with 25%, 50%, and 95% copayments. Since the
RAND HIE was published, there has been little dispute that the demand curve for health care
is not vertical (𝐷𝐼 ) but in fact downward-sloping (𝐷𝐸 ).
2. Oregon Medicaid Experiment: A similar study later conducted, comparing two groups of low-
income adult Oregonians: people who received the opportunity to apply for public health
insurance coverage, and people who were not given this change.
, Defining quantity 𝑄 and price 𝑃 is not so straightforward in health care, since there are different
kinds of health care and the price is mostly paid by health insurers or the government.
− Outpatient care or ambulatory care: Any interaction with a doctor or other medical care
professional that does not involve an overnight stay. Shows in both the RAND HIE study and
the Oregon Medicaid Experiment a statistically significant downward-sloping demand curve.
− Inpatient care: Any interaction with a doctor or other medical care professional that does
involves an overnight stay. Shows in the RAND HIE study a statistically significant downward-
sloping demand, but not as much as by outpatient care. The Oregon Medicaid Experiment
did not show any statistically significant downward-sloping demand at inpatient care.
The China Rural Health Insurance Experiment (CRHIE) conducted by RAND researchers and largely
modeled on the RAND HIE, finds similar patterns.
− For pediatric care (care for infants and children which is typically paid for by parents) the
RAND HIE shows a downward-sloping demand at 0-6 years old, but not to older children and
adolescents (ages 7-16). The RAND HIE and Oregon Medicaid Experiment also gathered data
from mental health care, dental care, and prescription drug use. In each case, both studies
find strong evidence of downward-sloping demand.
Elasticity of demand: the slope of the demand curve; the ratio that represents how a fixed
percentage change in the price of a good leads to a change in the quantity demanded, measured
as a percentage change from the original quantity.
(𝑄2 − 𝑄1 )/𝑄1
𝜖=
(𝑃2 − 𝑃1 )/𝑃1
Where 𝑄1 is the original quantity at price 𝑃1 and 𝑄2 the new quantity demanded after price
change from 𝑃1 to 𝑃2 . Note that this has to be negative (mostly −1 < 𝜖 < 0) when the demand is
downward-sloping!
The choice for a starting point for the price makes a big difference in the calculation of elasticity.
An alternative formation is called the arc elasticity.
∆𝑄/(𝑄1 + 𝑄2 )
𝜖𝑎𝑟𝑐 =
∆𝑃/(𝑃1 + 𝑃2 )
Where ∆𝑄 = 𝑄2 − 𝑄1 and ∆𝑃 = 𝑃2 − 𝑃1 . When demand is downward-sloping, this has to be
negative (mostly −1 < 𝜖𝑎𝑟𝑐 < 0) as well!
The RAND HIE and Oregon Medicaid Experiment found that more affordable care does not
measurably improve health for some populations, but not for most of the population. So there seems
to be no statistically significant evidence that the price of health care affects health itself.