Lecture 1
Distribution
SPSS syntax
FREQUENCIES
VARIABLES=X
/HISTOGRAM
/ORDER= ANALYSIS
Central tendency = most characteristic score of a distribution.
N
o Mean:
∑ Xi
i=1
X=
N
o Median
o Mode
Dispersion = how much do scores deviate from the most characteristic score.
o Range
N
o Variance: SS
∑ (X i− X)2
S2 = = i=1
N−1 N−1
o Standard deviation s= √ s2
Hypothesis testing
In hypothesis testing, you examine whether the mean of the population is equal to a certain
value or not.
o Hypothesis are exclusive and exhaustive
Two-sided test (H1: ≠), one-sided test (H1 contains < or >).
o SPSS output is always two-sided, so convert two-
sided Sig. to correct p-value.
Rules of thumb for creating hypothesis:
o H0 contains ‘=’ – always the case.
o H1 contains expectations of researcher – often.
Steps:
1. Formulate hypothesis.
2. Determine decision rule to decide when a result is
statistically significant: ρ ≤ 𝛼.
3. Determine p-value based on SPSS output.
4. Decision on significance and conclusion.
SPSS syntax
T-TEST
/TESTVAL= …
/MISSING=ANALYSIS
/VARIABLES=X
/CRITERIA=CIN (.95) .
Logic hypothesis testing
o Step 1: Make an assumption about the value of a parameter.
o Step 2:
Given that the value is true, you determine the possible values the sample
statistics can take in a simple random sample of N cases.
Using that sampling distribution, you determine the p-value that the value of
X or a more extreme value occurs.
, o Step 3: You determine the position of X in the sample distribution.
o Step 4:
If p-value is lower than 𝛼, you reject H0
If p-value is larger than 𝛼, you do not reject H0.
Point estimation = which values lies closest to the population value.
Confidence interval
With CIs, you answer the question: “What is the interval in which the value of the parameter
lies with …% confidence?”
X ± t cv × s / √ N
Relation CIs and testing
o Decision rule: two-sided test with significance level 𝛼
o D
o D
o D
o D
o D
o Assume H0 is true:
95% of all possible samples will produce a CI 95 in which μ H falls.
0
Correctly not reject H0
5% of all possible samples will produce a CI95 in which μ H does not fall.
0
Incorrectly rejecting H0 = type I error.
Testing means
One population:
D
D
Two populations
D
When using independent samples test in SPSS use Levene’s test (sig.) to determine whether to use
sig. (2-tailed) of equal variances assumed or equal variances not assumed.
Not significant first row – equal variances assumed.
Significant second row – equal variances not assumed.
Lecture 2
Power of a test
Power = probability of correctly rejecting the null
hypothesis if this is indeed the correct decision.
o Small alpha, large power.
Steps for determining power:
o Determine the Z for the given H0
o Determine sample mean that belongs with Z
for the given H0.
, o Convert the critical value X to the Z-value for the
given H1.
o The power is equal to the change:
P( Z ≥ Z H 1 ⎸ H 1 )
Four factors that influence power:
o Alpha
Lower alpha, means smaller critical value.
Higher alpha, means larger critical value – higher statistical power
o The sample size
The larger the sample size, the smaller the standard error and the larger Z-
score higher statistical power.
o σ (= SD)
The smaller the SD, the smaller the standard error and the larger Z-score
higher statistical power.
o The ‘true 𝜇’ in the alternative hypothesis
Larger effect size.
Effect size
When H0 is rejected based on a hypothesis test significant.
o But does not mean that is has definitively been proven that there is a systematic
effect.
o Does also not mean that the effect is practically/clinically relevant.
Because
If N is small, power is small, statistically not significant, even if effect
is large.
If N is big, power is larger, statistically significant, even if effect is
small.
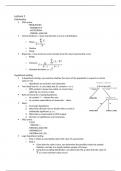
Two important measures of effect size when comparing means:
o Cohen’s D – how large is the relative difference in the groups?
o (Partial) explained variance η2 – how much of the variance is explained by group
membership?
Rules of thumb interpretating effect size:
oSmall effect: a lot of overlap between the two distributions.
50% of experimental group scores higher than average of control group.
o Large effect: not much overlap between the two distributions.
80% of experimental group scores higher than average of control group.
Formulas:
o One group:
o
d=t
Two groups:
√ 1
N
d=t
√ 1 1
+
n1 n2
Voordelen van het kopen van samenvattingen bij Stuvia op een rij:
Verzekerd van kwaliteit door reviews
Stuvia-klanten hebben meer dan 700.000 samenvattingen beoordeeld. Zo weet je zeker dat je de beste documenten koopt!
Snel en makkelijk kopen
Je betaalt supersnel en eenmalig met iDeal, creditcard of Stuvia-tegoed voor de samenvatting. Zonder lidmaatschap.
Focus op de essentie
Samenvattingen worden geschreven voor en door anderen. Daarom zijn de samenvattingen altijd betrouwbaar en actueel. Zo kom je snel tot de kern!
Veelgestelde vragen
Wat krijg ik als ik dit document koop?
Je krijgt een PDF, die direct beschikbaar is na je aankoop. Het gekochte document is altijd, overal en oneindig toegankelijk via je profiel.
Tevredenheidsgarantie: hoe werkt dat?
Onze tevredenheidsgarantie zorgt ervoor dat je altijd een studiedocument vindt dat goed bij je past. Je vult een formulier in en onze klantenservice regelt de rest.
Van wie koop ik deze samenvatting?
Stuvia is een marktplaats, je koop dit document dus niet van ons, maar van verkoper sabinevandenbrom. Stuvia faciliteert de betaling aan de verkoper.
Zit ik meteen vast aan een abonnement?
Nee, je koopt alleen deze samenvatting voor €5,48. Je zit daarna nergens aan vast.