100% tevredenheidsgarantie Direct beschikbaar na je betaling Lees online óf als PDF Geen vaste maandelijkse kosten
logo-home
Straighterline Introduction to Statistics exam questions and answers €10,29
In winkelwagen

Tentamen (uitwerkingen)

Straighterline Introduction to Statistics exam questions and answers

 1 keer verkocht
  • Vak
  • Instelling

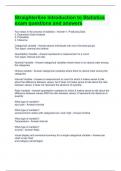
Straighterline Introduction to Statistics exam questions and answers used to find events of the type events of the type "A or B" General Multiplication Rule - Answer-P(A and B) = P(A) * P(B | A) Used for events of the type "A and B" or when A and B are independent: P(A and B) = P(A) * P...

[Meer zien]
Voorbeeld 2 van de 5  pagina's

  • 22 maart 2024
  • 5
  • 2023/2024
  • Tentamen (uitwerkingen)
  • Vragen en antwoorden
avatar-seller
Straighterline Introduction to Statistics exam questions and answers
Four steps in the process of statistics - Answer-1. Producing Data
2. Exploratory Data Analysis
3. Probability
4. Inference
Categorical variable - Answer-places individuals into one of several groups
Two types: nominal and ordinal
Quantitative Variable - Answer-represents a measurement or a count
Two types: Interval and ratio
Nominal Variable - Answer-categorical variables where there is no natural order among the categories
Ordinal variable - Answer-categorical variables where there is natural order among the categories
Interval Variable - Answer-a measurement or count for which it makes sense to talk about the difference between values, but it does not make sense to talk about the ratio between values; 0 does not represent the absence of quanitity
Ratio Variable - Answer-quantitative variables for which it makes sense to talk about the
difference between values AND the ratio between values; 0 represents the absence of quantity
What type of variable?:
eye color - Answer-nominal
What type of variable?:
socioeconomic status with categories low, med, high - Answer-Ordinal
What type of variable?:
Temperature - Answer-Interval
What type of variable?:
Income - Answer-Ratio
Visual display and numerical summary for a single categorical variable - Answer-pie chart or bar chart
and category percentages Visual display and numerical summary for a single quantitative variable - Answer-
histogram or stemplot and descriptive statistics
Visual display and numerical summary for C->C - Answer-Two way table and conditional percentages
Visual display and numerical summary for C->Q - Answer-Side by side box plots and descriptive statistics
Visual display and numerical summary for Q->Q - Answer-Scatterplot and correlation coefficient (r)
Standard Deviation Rule - Answer-Approximately 68% of observations fall within 1 sd of the mean, 95% within 2 sd, 99.7% (or virtually all) within 3 sds
Interquartile Range (IQR) - Answer-Middle 50% of the data
IQR= Q3-Q1
Finding an outlier using IQR - Answer-An observation is considered a suspected outlier if it is:
less than Q1 - 1.5(IQR), or
more than Q3 + 1.5(IQR).
Interpreting scatterplots:
1. positive relationship displays as
2. negative relationship displays as - Answer-1. upward slope
2. downward slope
Interpreting Scatterplots:
How to tell if a linear relationship is strong or weak - Answer-closer to -1 is a strong negative linear relationship
closer to +1 is a strong positive linear relationship
close to 0 is a weak linear relationship
Interpreting Scatterplots:
Linear regression - Answer-Finding the line that best fits the pattern of the linear relationship (the line that describes how the response variable linearly depends on the explanatory variable
Interpreting Scatterplots:
Least Squares Regression Line - Answer-Has the smallest sum of squared vertical deviations of the data points from the line.

Dit zijn jouw voordelen als je samenvattingen koopt bij Stuvia:

Bewezen kwaliteit door reviews

Bewezen kwaliteit door reviews

Studenten hebben al meer dan 850.000 samenvattingen beoordeeld. Zo weet jij zeker dat je de beste keuze maakt!

In een paar klikken geregeld

In een paar klikken geregeld

Geen gedoe — betaal gewoon eenmalig met iDeal, creditcard of je Stuvia-tegoed en je bent klaar. Geen abonnement nodig.

Direct to-the-point

Direct to-the-point

Studenten maken samenvattingen voor studenten. Dat betekent: actuele inhoud waar jij écht wat aan hebt. Geen overbodige details!

Veelgestelde vragen

Wat krijg ik als ik dit document koop?

Je krijgt een PDF, die direct beschikbaar is na je aankoop. Het gekochte document is altijd, overal en oneindig toegankelijk via je profiel.

Tevredenheidsgarantie: hoe werkt dat?

Onze tevredenheidsgarantie zorgt ervoor dat je altijd een studiedocument vindt dat goed bij je past. Je vult een formulier in en onze klantenservice regelt de rest.

Van wie koop ik deze samenvatting?

Stuvia is een marktplaats, je koop dit document dus niet van ons, maar van verkoper Rusenna. Stuvia faciliteert de betaling aan de verkoper.

Zit ik meteen vast aan een abonnement?

Nee, je koopt alleen deze samenvatting voor €10,29. Je zit daarna nergens aan vast.

Is Stuvia te vertrouwen?

4,6 sterren op Google & Trustpilot (+1000 reviews)

Afgelopen 30 dagen zijn er 68175 samenvattingen verkocht

Opgericht in 2010, al 15 jaar dé plek om samenvattingen te kopen

Begin nu gratis
€10,29  1x  verkocht
  • (0)
In winkelwagen
Toegevoegd