● Factor analysis
1. You use it for more complicated issues than issues you can use a one-item scale for. So multi-item
scales needed.
The purpose is reduction of much data by finding common variance. The ultimate goal is using
dimensions in further analysis. Data can be interval- or ratio scaled. Or assumed interval which is
ordinal (Likert). Usually IV, no causal relation. n items will be p factors.
- use it for parsimony
- use it to reduce multicollinearity
Check correlation matrix first.
After putting them into factors, you have dimensions which are now uncorrelated with each other.
- Items = variables = survey questions
- Dimensions = factors = components
2. Is FA appropriate?
Barlett’s test
- H0: variables are uncorrelated, i.e. the identity matrix
KMO
- If KMO <0.5, drop variable with lowest individual KMO statistics
NOTE also check the communalities. Common rule: >.4
The communalities measure the percent of variance in a given variable explained by all the extracted
factors. This is < 1, since we have fewer factors than variables.
3. Select factor model to get the weights wij
- See how the variables combine into factors: PCA (Principal Component Analysis)
4. Select best number of factors
,5. Orthogonal rotation prevents that all variables load on one factor. Does not change the variance
explained.
Common factor analysis: factors are estimated based only on the common variance.
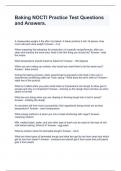
Eigenvalues are in decreasing order of magnitude as we go from factor 1 to factor 6. Eigenvalue of a
factor indicates the total variance attributed to that factor, so should be as high as possible. See p.
641. Eigenvalue divided by number of factors is % of variance.
Deciding how many factors you should choose can be done by:
o A priori determination
o Determination based on eigenvalues
o Determination based on a scree plot
o Determination based on percentage of
variance
o Determination based on split-half reliability
o Determination based on significance tests
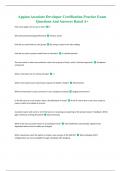
6. interpreting and labeling factors.
The ones of F3 are as highest around .4 but that is not high enough. Should be 0.5 or higher. X14 is
not really clear if it belongs to F1 or F2. Exclude these variables and do factor analysis again.
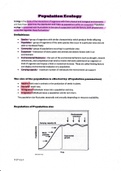
7. Subsequent use of factors. Use obtained factors as new variables. Calculate factor scores for each
respondent or use reliability analysis. Internal consistency (reliability):
, >> p-value
would go from
0.589 to 0.601
if item
deleted.
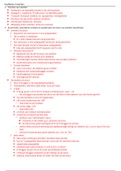
• Cluster analysis
Gap in brands and also a cluster of
people in this gap? Then you could
make a new brand there. This can
be done by combining cluster and
factor analysis.
Dividing a heterogeneous sample in
homogeneous groups based on a
set of (active) variables.
-Making groups that are internally
as similar as possible, but are as
different as possible from other
groups
Active variables: used for clustering
Passive variables: used for group identification, e.g. demographics)
1. segmentation basis (active variables).
2. Scores on each variable can be transformed / standardized, e.g., to have a mean of 0 and a
variance of 1 (Z-scores). Do this in SPSS when performing analysis.
3. Hierarchical :
- -Can be agglomerative (most often) or divisive
- -Based on pairwise distances
- -Preferred: Ward’s method
- -Uses Squared Euclidean Distance
- -Produces tree (dendrogram)
Non Hierarchical:
- -Pre-specify #clusters
- -Start with certain clusters (centres) and add other observations
1. You use it for more complicated issues than issues you can use a one-item scale for. So multi-item
scales needed.
The purpose is reduction of much data by finding common variance. The ultimate goal is using
dimensions in further analysis. Data can be interval- or ratio scaled. Or assumed interval which is
ordinal (Likert). Usually IV, no causal relation. n items will be p factors.
- use it for parsimony
- use it to reduce multicollinearity
Check correlation matrix first.
After putting them into factors, you have dimensions which are now uncorrelated with each other.
- Items = variables = survey questions
- Dimensions = factors = components
2. Is FA appropriate?
Barlett’s test
- H0: variables are uncorrelated, i.e. the identity matrix
KMO
- If KMO <0.5, drop variable with lowest individual KMO statistics
NOTE also check the communalities. Common rule: >.4
The communalities measure the percent of variance in a given variable explained by all the extracted
factors. This is < 1, since we have fewer factors than variables.
3. Select factor model to get the weights wij
- See how the variables combine into factors: PCA (Principal Component Analysis)
4. Select best number of factors
,5. Orthogonal rotation prevents that all variables load on one factor. Does not change the variance
explained.
Common factor analysis: factors are estimated based only on the common variance.
Eigenvalues are in decreasing order of magnitude as we go from factor 1 to factor 6. Eigenvalue of a
factor indicates the total variance attributed to that factor, so should be as high as possible. See p.
641. Eigenvalue divided by number of factors is % of variance.
Deciding how many factors you should choose can be done by:
o A priori determination
o Determination based on eigenvalues
o Determination based on a scree plot
o Determination based on percentage of
variance
o Determination based on split-half reliability
o Determination based on significance tests
6. interpreting and labeling factors.
The ones of F3 are as highest around .4 but that is not high enough. Should be 0.5 or higher. X14 is
not really clear if it belongs to F1 or F2. Exclude these variables and do factor analysis again.
7. Subsequent use of factors. Use obtained factors as new variables. Calculate factor scores for each
respondent or use reliability analysis. Internal consistency (reliability):
, >> p-value
would go from
0.589 to 0.601
if item
deleted.
• Cluster analysis
Gap in brands and also a cluster of
people in this gap? Then you could
make a new brand there. This can
be done by combining cluster and
factor analysis.
Dividing a heterogeneous sample in
homogeneous groups based on a
set of (active) variables.
-Making groups that are internally
as similar as possible, but are as
different as possible from other
groups
Active variables: used for clustering
Passive variables: used for group identification, e.g. demographics)
1. segmentation basis (active variables).
2. Scores on each variable can be transformed / standardized, e.g., to have a mean of 0 and a
variance of 1 (Z-scores). Do this in SPSS when performing analysis.
3. Hierarchical :
- -Can be agglomerative (most often) or divisive
- -Based on pairwise distances
- -Preferred: Ward’s method
- -Uses Squared Euclidean Distance
- -Produces tree (dendrogram)
Non Hierarchical:
- -Pre-specify #clusters
- -Start with certain clusters (centres) and add other observations