100% tevredenheidsgarantie Direct beschikbaar na je betaling Lees online óf als PDF Geen vaste maandelijkse kosten
logo-home
Test Bank for Introduction to Data Mining 2nd Edition (Global Edition) By Pang-Ning Tan, Michael Steinbach, Vipin Kumar (All Chapters, 100% Original Verified, A+ Grade) €27,98
In winkelwagen

Tentamen (uitwerkingen)

Test Bank for Introduction to Data Mining 2nd Edition (Global Edition) By Pang-Ning Tan, Michael Steinbach, Vipin Kumar (All Chapters, 100% Original Verified, A+ Grade)

1 beoordeling
 1 keer verkocht
  • Vak
  • Introduction to Data Mining 2nd Edit
  • Instelling
  • Introduction To Data Mining 2nd Edit

This Is Original 2nd Edition of Test Bank From Original Author. All Other Files in the market are fake/old Edition. Other Sellers Have changed old Edition Number to new But Test Bank is old Edition. Test Bank for Introduction to Data Mining 2nd Edition (Global Edition) By Pang-Ning Tan, Michael...

[Meer zien]
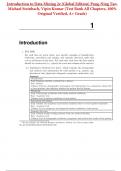
Voorbeeld 4 van de 233  pagina's

  • 15 april 2024
  • 233
  • 2023/2024
  • Tentamen (uitwerkingen)
  • Vragen en antwoorden
  • Introduction to Data Mining 2nd Edit
  • Introduction to Data Mining 2nd Edit

1  beoordeling

review-writer-avatar

Door: garenachannel • 5 maanden geleden

avatar-seller
Introduction to Data Mining 2e (Global Edition) Pang-Ning Tan,
Michael Steinbach, Vipin Kumar (Test Bank All Chapters, 100%
Original Verified, A+ Grade)


1

Introduction
1. [Fall 2008]
For each data set given below, give specific examples of classification,
clustering, association rule mining, and anomaly detection tasks that
can be performed on the data. For each task, state how the data matrix
should be constructed (i.e., specify the rows and columns of the matrix).

(a) Ambulatory Medical Care data1 , which contains the demographic
and medical visit information for each patient (e.g., gender, age,
duration of visit, physician’s diagnosis, symptoms, medication, etc).
Answer:
Classification
Task: Diagnose whether a patient has a disease.
Row: Patient
Column: Patient’s demographic and hospital visit information (e.g., symptoms), along with
a class attribute that indicates whether the patient has the disease.
Clustering
Task: Find groups of patients with similar medical conditions
Row: A patient visit
Column: List of medical conditions of each patient
Association rule mining
Task: Identify the symptoms and medical conditions that co-occur together frequently
Row: A patient visit
Column: List of symptoms and diagnosed medical conditions of the patient
Anomaly detection
Task: Identify healthy looking patients with rare medical disorders
Row: A patient visit
Column: List of demographic attributes, symptoms, and medical test results of the patient
1
See for example, the National Hospital Ambulatory Medical Care Survey http://www.
cdc.gov/nchs/about/major/ahcd/ahcd1.htm

,2 Chapter 1 Introduction

(b) Stock market data, which include the prices and volumes of various
stocks on different trading days.
Answer:
Classification
Task: Predict whether the stock price will go up or down the next trading day
Row: A trading day
Column: Trading volume and closing price of the stock the previous 5 days and a class
attribute that indicates whether the stock went up or down
Clustering
Task: Identify groups of stocks with similar price fluctuations
Row: A company’s stock
Column: Changes in the daily closing price of the stock over the past ten years
Association rule mining
Task: Identify stocks with similar fluctuation patterns(e.g., {Google-Up, Yahoo-Up})
Row: A trading day
Column: List of all stock-up and stock-down events on the given day.
Anomaly detection
Task: Identify unusual trading days for a given stock (e.g., unusually high volume)
Row: A trading day
Column: Trading volume, change in daily stock price (daily high − low prices), and average
price change of its competitor stocks
(c) Database of Major League Baseball (MLB).

Classification
Task: Predict the winner of a game between two MLB teams.
Row: A game.
Column: Statistics of the home and visiting teams over their past 10 games they had played
(e.g., average winning percentage and hitting percentage of their players)
Clustering
Task: Identify groups of players with similar statistics
Row: A player
Column: Statistics of the player
Association rule mining
Task: Identify interesting player statistics (e.g., 40% of right-handed players have a batting
percentage below 20% when facing left-handed pitchers)
Row: A player
Column: Discretized statistics of the player
Anomaly detection
Task: Identify players who performed considerably better than expected in a given season
Row: A (player,season) pair e.g, (player1 in 2007)
Column: Ratio statistics of a player (e.g., ratio of average batting percentage in 2007 to
career average batting percentage)


2

, 2

Data
2.1 Types of Attributes
1. Classify the following attributes as binary, discrete, or continuous. Also
classify them as qualitative (nominal or ordinal) or quantitative (interval
or ratio). Some cases may have more than one interpretation, so briefly
indicate your reasoning if you think there may be some ambiguity.

(a) Number of courses registered by a student in a given semester.
Answer: Discrete, quantitative, ratio.
(b) Speed of a car (in miles per hour).
Answer: Discrete, quantitative, ratio.
(c) Decibel as a measure of sound intensity.
Answer: Continuous, quantitative, interval or ratio. It is actually
a logratio type (which is somewhere between interval and ratio).
(d) Hurricane intensity according to the Saffir-Simpson Hurricane Scale.
Answer: Discrete, qualitative, ordinal.
(e) Social security number.
Answer: Discrete, qualitative, nominal.

2. Classify the following attributes as:

• discrete or continuous.
• qualitative or quantitative
• nominal, ordinal, interval, or ratio

, 4 Chapter 2 Data

Some cases may have more than one interpretation, so briefly indicate
your reasoning if you think there may be some ambiguity.

(a) Julian Date, which is the number of days elapsed since 12 noon
Greenwich Mean Time of January 1, 4713 BC.
Answer: Continuous, quantitative, interval
(b) Movie ratings provided by users (1-star, 2-star, 3-star, or 4-star).
Answer: Discrete, qualitative, ordinal
(c) Mood level of a blogger (cheerful, calm, relaxed, bored, sad, angry
or frustrated).
Answer: Discrete, qualitative, nominal
(d) Average number of hours a user spent on the Internet in a week.
Answer: Continuous, quantitative, ratio
(e) IP address of a machine.
Answer: Discrete, qualitative, nominal
(f) Richter scale (in terms of energy release during an earthquake).
Answer: Continuous, qualitative, ordinal
In terms of energy release, the difference between 0.0 and 1.0 is not
the same as between 1.0 and 2.0. Ordinal attributes are qualitative;
yet, can be continuous.
(g) Salary above the median salary of all employees in an organization.
Answer: Continuous, quantitative, interval
(h) Undergraduate level (freshman, sophomore, junior, and senior) for
measuring years in college.
Answer: Discrete, qualitative, ordinal

3. For each attribute given, classify its type as:

• discrete or continuous AND
• qualitative or quantitative AND
• nominal, ordinal, interval, or ratio

Indicate your reasoning if you think there may be some ambiguity in
some cases.
Example: Age in years.
Answer: Discrete, quantitative, ratio.

4

Dit zijn jouw voordelen als je samenvattingen koopt bij Stuvia:

Bewezen kwaliteit door reviews

Bewezen kwaliteit door reviews

Studenten hebben al meer dan 850.000 samenvattingen beoordeeld. Zo weet jij zeker dat je de beste keuze maakt!

In een paar klikken geregeld

In een paar klikken geregeld

Geen gedoe — betaal gewoon eenmalig met iDeal, creditcard of je Stuvia-tegoed en je bent klaar. Geen abonnement nodig.

Direct to-the-point

Direct to-the-point

Studenten maken samenvattingen voor studenten. Dat betekent: actuele inhoud waar jij écht wat aan hebt. Geen overbodige details!

Veelgestelde vragen

Wat krijg ik als ik dit document koop?

Je krijgt een PDF, die direct beschikbaar is na je aankoop. Het gekochte document is altijd, overal en oneindig toegankelijk via je profiel.

Tevredenheidsgarantie: hoe werkt dat?

Onze tevredenheidsgarantie zorgt ervoor dat je altijd een studiedocument vindt dat goed bij je past. Je vult een formulier in en onze klantenservice regelt de rest.

Van wie koop ik deze samenvatting?

Stuvia is een marktplaats, je koop dit document dus niet van ons, maar van verkoper tutorsection. Stuvia faciliteert de betaling aan de verkoper.

Zit ik meteen vast aan een abonnement?

Nee, je koopt alleen deze samenvatting voor €27,98. Je zit daarna nergens aan vast.

Is Stuvia te vertrouwen?

4,6 sterren op Google & Trustpilot (+1000 reviews)

Afgelopen 30 dagen zijn er 69052 samenvattingen verkocht

Opgericht in 2010, al 15 jaar dé plek om samenvattingen te kopen

Begin nu gratis
€27,98  1x  verkocht
  • (1)
In winkelwagen
Toegevoegd