100% tevredenheidsgarantie Direct beschikbaar na je betaling Lees online óf als PDF Geen vaste maandelijkse kosten
logo-home
Summary Statistics 1 (GESTAT1)/Elementary Statistics for Geographers €7,99
In winkelwagen

Samenvatting

Summary Statistics 1 (GESTAT1)/Elementary Statistics for Geographers

1 beoordeling
 5 keer verkocht

This summary is all the information you will need to pass the Statistics 1 (resit) exam. It contains 8 very comprehensive subjects, which can be placed within the context of statistics. The summary is aligned with the decision tree I made. This summary is especially useful for students who have fo...

[Meer zien]
Voorbeeld 4 van de 32  pagina's

  • Onbekend
  • 18 februari 2019
  • 32
  • 2018/2019
  • Samenvatting
book image

Titel boek:

Auteur(s):

  • Uitgave:
  • ISBN:
  • Druk:
Alle documenten voor dit vak (3)

1  beoordeling

review-writer-avatar

Door: subscriptionaccount • 10 maanden geleden

avatar-seller
geography327
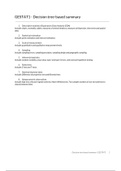
GESTAT1 - Decision tree-based summary

1. Descriptive statistics/Exploratory Data Analysis (EDA)
Includes charts, normality, tables, measures of central tendency, measures of dispersion, time series and spatial
data.

2. Statistical estimation
Includes point estimation and interval estimation.

3. Scale of measurement
Includes quantitative and qualitative measurement levels.

4. Sampling
Includes sampling errors, sampling procedure, sampling design and geographic sampling.

5. Inferential statistics
Includes random variables, prop-value, type I and type II errors, and classical hypothesis testing.

6. Ratio tests
Includes Z-test and T-tests.

7. Nominal (dummy) tests
Includes Difference of proportion test and Binomial test.

8. Nonparametric alternatives
Includes Sign test, wilcoxon-signed rank test, Mann-Whitney test, Two samples number of runs test and how to
choose between them.


Decision tree-based summary | GESTAT1 1

,January 2019


Decision tree-based summary | GESTAT1 2

,1. Descriptive statistics/Exploratory Data Analysis (EDA)
Lecture 2, 3


> ​Why: ​study the data in order to describe its key properties. Maybe some additional questions arise.
> ​What: f​ or each variable diagrams/tables and numerical summaries of distributions.

In EDA, you look at distributions: the shape, the center and the spread.
> If we can say that our variable has a particular distribution, this tells a lot about how likely certain
outcomes will be (if it’s close to the mean).
> The normal distribution is most used distribution, there are more.


1.1 Charts
Before choosing a chart, you have to consider:
> ​The measurement level​: ratio/interval, ordinal, nominal.
> ​The number of variables going into this particular EDA​: + what’s their relationship with each other?
> ​The number of cases:​ are there any groups?

Bar chart
A bar chart puts a bar for every value you have in the variable. There are no bars for values that don’t occur.
> Suitable for data with a limited number of values (categorial) : ​ordinal/nominal​. Also ratio variables, but you
have to group them first (after that e.g. compare means).
> You can have more variables in one bar chart to explain certain connections (→ bar chart for crosstables
(→ crosstables)).

Histogram
The software will compute ‘bins’ which helps clarify the distribution of the variable.
> Suitable for data with a lot of values, ready to be categorized: ​interval/ratio​.
> You can detect abnormalities.


Decision tree-based summary | GESTAT1 3

, Boxplot
Tells the distribution (just as the histogram).
> Suitable for ​detecting outliers i​ n your data (displayed with circles/stars and
case number).
> Box plot from bottom to top: 1.5 times height of the box, first quartile,
median, third quartile, 1.5 times height of the box , outliers.
> If you can’t find any good reason to leave out the outliers, leave them in.

Stem and leaf display
Gives the distribution and summarizes the data in a particular way (if you
rotate it 90 degrees you get sort of a histogram).
> Suitable for ​small datasets,​ you can easily draw it yourself.
> Cuts out the extreme values.


1.2 Normality
> Normal distribution: bell-shaped, symmetrical, unimodal. Completely
described by μ and σ (→ see figure).
> Sometimes, visuals (charts etc.) isn’t enough to decide if the variable is
normally distributed
→ skewness/kurtosis (only for ratio/interval).


Skewness Kurtosis
> Measure of (a)symmetry. > Measure of ‘peakyness’ or ‘flatness’.
> Approaches 0 for symmetric distributions > Approaches 3 for normal distributions.
(normal distribution have therefore no skew).
>3: leptokurtic: values concentrate around specific
>0: positive skew,:most values to the left of the mean. values (can have more peaks).
≈0: no skew: normal distribution. ≈3: mesokurtic: normal distribution.
<0: negative skew: most values to the right of the mean. <3: platykurtic: more uniform distributions.


Q-Q plot/quantile plot
> Has many names and there are a lot of different ways to run the plot: the outcome is the same.
> Plots observed value against the expected normal distribution (linear line): if it’s on the line, it’s normal.
> More precise than a histogram.


Decision tree-based summary | GESTAT1 4

Dit zijn jouw voordelen als je samenvattingen koopt bij Stuvia:

Bewezen kwaliteit door reviews

Bewezen kwaliteit door reviews

Studenten hebben al meer dan 850.000 samenvattingen beoordeeld. Zo weet jij zeker dat je de beste keuze maakt!

In een paar klikken geregeld

In een paar klikken geregeld

Geen gedoe — betaal gewoon eenmalig met iDeal, creditcard of je Stuvia-tegoed en je bent klaar. Geen abonnement nodig.

Direct to-the-point

Direct to-the-point

Studenten maken samenvattingen voor studenten. Dat betekent: actuele inhoud waar jij écht wat aan hebt. Geen overbodige details!

Veelgestelde vragen

Wat krijg ik als ik dit document koop?

Je krijgt een PDF, die direct beschikbaar is na je aankoop. Het gekochte document is altijd, overal en oneindig toegankelijk via je profiel.

Tevredenheidsgarantie: hoe werkt dat?

Onze tevredenheidsgarantie zorgt ervoor dat je altijd een studiedocument vindt dat goed bij je past. Je vult een formulier in en onze klantenservice regelt de rest.

Van wie koop ik deze samenvatting?

Stuvia is een marktplaats, je koop dit document dus niet van ons, maar van verkoper geography327. Stuvia faciliteert de betaling aan de verkoper.

Zit ik meteen vast aan een abonnement?

Nee, je koopt alleen deze samenvatting voor €7,99. Je zit daarna nergens aan vast.

Is Stuvia te vertrouwen?

4,6 sterren op Google & Trustpilot (+1000 reviews)

Afgelopen 30 dagen zijn er 69052 samenvattingen verkocht

Opgericht in 2010, al 15 jaar dé plek om samenvattingen te kopen

Begin nu gratis
€7,99  5x  verkocht
  • (1)
In winkelwagen
Toegevoegd