100% tevredenheidsgarantie Direct beschikbaar na je betaling Lees online óf als PDF Geen vaste maandelijkse kosten
logo-home
SPCE 630 Final Exam prep Questions and answers latest update €11,19
In winkelwagen

Tentamen (uitwerkingen)

SPCE 630 Final Exam prep Questions and answers latest update

 0 keer verkocht
  • Vak
  • Instelling

SPCE 630 Final Exam prep Questions and answers latest update visual analysis of graphed data is the cornerstone of and most frequently used data analysis method in SCD research, particularly for determining whether a study demonstrates experimental control. involves systematic procedures used to...

[Meer zien]
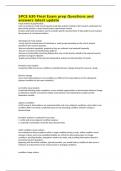
Voorbeeld 4 van de 33  pagina's

  • 25 mei 2024
  • 33
  • 2023/2024
  • Tentamen (uitwerkingen)
  • Vragen en antwoorden
avatar-seller
SPCE 630 Final Exam prep Questions and
answers latest update
visual analysis of graphed data
is the cornerstone of and most frequently used data analysis method in SCD research, particularly for
determining whether a study demonstrates experimental control.
involves systematic procedures used to evaluate specific characteristics of data patterns and evaluate
the presence of a functional relation.


advantages of visual analysis
-can be used to evaluate data of individuals or small groups depending on the unit of analysis
specified in the research question.
-data are collected repeatedly, graphed as they are collected, and analyzed frequently
-focuses on analysis of individual data patterns
-discovery of potentially interesting findings that may not be directly related to the original research
question or program objective.
-graphic presentation of data permits independent analysis and interpretation of results


formative visual analysis
conducted within and across conditions to identify behavior change during the course of a study.


behavior change
occurs when data patterns in one condition are different from data patterns in the subsequent,
adjacent condition for the same variable(s).


summative visual analysis
conducted following study completion, across multiple opportunities to demonstrate behavior change
to determine whether a functional relation exists between the independent variable and the
dependent variable.


adjacent conditions
in SCD research, data patterns are examined within and across adjacent conditions; when data in one
condition differ from what is predicted based on the preceding condition, behavior change is
demonstrated.


formative analysis is conducted in two steps
1. within and across adjacent condition analyses
2. systematic examination of specific data characteristics


within condition visual analyses
are conducted to discern patterns within a single condition during a study. within condition visual
analyses of level, trend, and variability/stability are critical for determining when to change
conditions, deciding whether adaptations need to be made, and providing information related to
answering research questions.
beginning with the initial condition, typically baseline, you should look for stability of data across a
minimum of at least three to five sessions prior to changing conditions.


condition change criteria

,should be made a priori based on hypothesized data patterns. these criteria will guide both formative
and summative decisions about experimental control.


level
refers to the amount of behavior that occurs, as indicated by the ordinate scale value. the
characteristic of highest interest for behavior change, and is generally described as low, moderate, or
high.


trend
the slope and direction of a data series or the direction data are moving over time. three
characteristics can be described: trend directions, trend magnitude, and trend stability.


trend direction
referred to as accelerating, decelerating, or zero celebrating. trend can further be characterized by
magnitude, and is often described as steep or gradual and paired with direction. also describe
whether the direction of a trend is improving (therapeutic) or deteriorating (contra-therapeutic).


contra therapeutic trend
represents a common data pattern in SCD data that might occur within a condition and particularly
prior to the introduction of the independent variable. this refers to trends that are in the opposite
direction of the hypothesized direction of improvement and can establish need for the intervention.


variability
fluctuation from one data point to the next and is the opposite of stability; in data with no trend, this
can be summarized as the range of data values within a condition or as the percentage of data points
falling within a given stability envelope


stability
is predictability and consistency of data values within a condition. perceptions of this can be
influenced by scales and ranges of y axes.


between condition visual analysis
the objective of this is to identify if behavior change has occurred. in SCD research a particular
condition (B) is introduced and re-introduced to one (eg. A-B-A-B) or more than one (multiple baseline
design) data series to evaluate whether there is a functional relation between independent and
dependent variables.


functional relations
are unequivocal demonstrations that an independent variable produced reliable and consistent
change in a dependent variable. the purpose of SCD research is to determine if behavior change
occurs when the intervention is introduced, and whether the behavior change can vive reliably
replicated.


analysis of data across adjacent conditions entails determining:
a) changes in data patterns (level, trend, variability) b) immediacy of change c) amount of overlapping
data across adjacent conditions d) consistency of data patterns across similar conditions

,immediacy of change
across adjacent conditions is the degree to which behavior change occurs as soon as the intervention
is introduced. when a large change in level occurs immediately after introduction of a new condition,
it is referred to as an abrupt change in level, which is indicative of an immediately powerful or
immediately effective intervention.


overlap
refers to values of data in one condition that are in the same range of values of data in the
subsequent, adjacent condition.


consistency
refers to the extent to which data patterns in one condition are similar to data patterns in other
conditions. confident determination that a functional relation exists requires consistency in data
patterns between iterations of the same condition and inconsistency in data patterns between
different, adjacent conditions.


potential demonstrations of effect
a functional relation can be identified when a) there is a sufficient number of this (three opportunities
to demonstrate behavior change contingent on condition change) and b) visual analysis suggests that
consistent changes in data occur for all potential demonstrations


the presence of a functional relation can be confirmed when
a) there is a successful attempt to replicate effects of a condition b) similar conditions generate similar
levels and trends within (intra participant replication) and across (inter participant replication)
participants in a study. a minimum of three demonstrations of behavior change is required to
establish experimental control


magnitude
if a functional relation is present, this, or amount of behavior change may be of interest. magnitude of
effect is assessed by comparing the amount and consistency of change across conditions and cases
within a study that is directly attributed to the intervention.


systematic process for conducting visual analysis
1. adequate number of data points within conditions to establish data patterns.
2. clear patterns within conditions in level, trend, or stability
3. behavior change between adjacent conditions in level, trend, and/or variability
4. degree of overlap and immediacy of change in data patterns across adjacent conditions
5. consistency of changes across conditions and cases
6. predicted patterns of change
7. magnitude of change across conditions and cases


visual analysis requires a plan
a) deciding how often data will be graphed
b) considering how data will be graphically displayed
c) determining which data characteristics will be the focus of within and between condition analyses
d) identifying design related criteria that will impact visual analysis


determining a schedule for graphing data, you should

, a) ensure data are graphed regularly enough to inform decision making with respect to implementing
the design as planned and b) identify relevant threats to internal validity that can be detected visually


identifying design related criteria
a) minimum number of sessions per condition and b) explicit criteria for changing conditions


summative analysis should focus on
a) within condition data patterns were stable b) hypothesized between condition shifts in data
patterns were detected and c) these shifts consistently co occurred with each change in condition


split middle method
a tool that can be used to estimate trend within conditions and compare trends between conditions.
these are most useful when within condition trends or between condition changes in trend are of
primary interest and data show moderate or high variability within conditions.


stability envelopes
can be used to estimate stability in level or trend within conditions. the primary advantage of this is to
ensure consistency in experimental decisions related to data stability.


percentage of non overlapping data
may be used to estimate level change between two adjacent conditions. the higher the PND, the
more consistent and abrupt the level change between adjacent conditions. a PND of 100% indicates
no overlap in the ranges of values between two adjacent conditions.


baseline logic
serves as the foundation for all single case design research. all SCDS are mere extensions of the basic
A-B paradigms, wherein behavior is measured repeatedly across two adjacent conditions: baseline (A)
and intervention (B).


single case experimental designs
some authors refer to designs with at least three demonstrations of effect as this.


non experimental variations
A-B designs
referred to s the simple time series design, represents the most basic non experimental SCD. this
design requires that the dependent variable be measured repeatedly under controlled baseline (A)
and intervention (B) conditions.


A-B-A designs
the target behavior is repeatedly measured under baseline (A1) and intervention (B) conditions. after
the dependent variable has stabilized during intervention, you reintroduce the baseline condition (A2)
to the target behavior. this design is susceptible to numerous threats of internal and external validity.


A-B-A-B Withdrawal design
also referred to as reversal design, has been one of the most frequently used SCDs in behavioral
research. this design permits a clear and convincing demonstration of experimental control because it
requires the repeated introduction and withdrawal of an intervention.

Dit zijn jouw voordelen als je samenvattingen koopt bij Stuvia:

Bewezen kwaliteit door reviews

Bewezen kwaliteit door reviews

Studenten hebben al meer dan 850.000 samenvattingen beoordeeld. Zo weet jij zeker dat je de beste keuze maakt!

In een paar klikken geregeld

In een paar klikken geregeld

Geen gedoe — betaal gewoon eenmalig met iDeal, creditcard of je Stuvia-tegoed en je bent klaar. Geen abonnement nodig.

Direct to-the-point

Direct to-the-point

Studenten maken samenvattingen voor studenten. Dat betekent: actuele inhoud waar jij écht wat aan hebt. Geen overbodige details!

Veelgestelde vragen

Wat krijg ik als ik dit document koop?

Je krijgt een PDF, die direct beschikbaar is na je aankoop. Het gekochte document is altijd, overal en oneindig toegankelijk via je profiel.

Tevredenheidsgarantie: hoe werkt dat?

Onze tevredenheidsgarantie zorgt ervoor dat je altijd een studiedocument vindt dat goed bij je past. Je vult een formulier in en onze klantenservice regelt de rest.

Van wie koop ik deze samenvatting?

Stuvia is een marktplaats, je koop dit document dus niet van ons, maar van verkoper ACADEMICAIDSTORE. Stuvia faciliteert de betaling aan de verkoper.

Zit ik meteen vast aan een abonnement?

Nee, je koopt alleen deze samenvatting voor €11,19. Je zit daarna nergens aan vast.

Is Stuvia te vertrouwen?

4,6 sterren op Google & Trustpilot (+1000 reviews)

Afgelopen 30 dagen zijn er 69052 samenvattingen verkocht

Opgericht in 2010, al 15 jaar dé plek om samenvattingen te kopen

Begin nu gratis
€11,19
  • (0)
In winkelwagen
Toegevoegd