100% tevredenheidsgarantie Direct beschikbaar na betaling Zowel online als in PDF Je zit nergens aan vast
logo-home
Summary Introduction to Biomedical Sciences Notes for year 1 () €8,16
In winkelwagen

Samenvatting

Summary Introduction to Biomedical Sciences Notes for year 1 ()

 8 keer bekeken  0 keer verkocht

IBMS , Introduction To Biomedical Sciences Notes. I got a8.6 in the exams with these notes. It has everything needed from WG and lectures. I didn't even need the lecture slides and the videos to revise. It was written in September- October 2023 (Period 1) for academic year .

Voorbeeld 2 van de 10  pagina's

  • 29 mei 2024
  • 10
  • 2023/2024
  • Samenvatting
Alle documenten voor dit vak (4)
avatar-seller
baltzievdokia
INTRODUCTION TO BIOMEDICAL SCIENCES
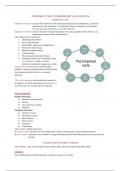
Empirical cycle
Empirical research: research that is based on observation and measurement of phenomena, as directly
experiences by the researcher. It is based on evidence compared to a hypothesis.
It is only one type of research, it is not the only way.
Empirical evidence: refers to objective evidence that appears the same, regardless of the observer. (ex.
temperature measured with a thermometer).
The empirical cycle consists of:
1. Identifying the problem
2. Reviewing literature
3. Setting RQs, objectives and hypotheses
4. Choose the study design
5. Decide the sample design
6. Collecting data
7. Processing and analyzing the data
8. Writing the report and evaluating the data
To remember: I really see chaos
distruction completely proggressive wreck.
Empyrical cycle: the process of identifying a
problem, coming up with hypotheses which are then
tested against empirical data in a systematic
approach.

The cycle’s purpose: help scientists do research in
an objective (as much as possible) way, however, it
is not the only way research can be conducted.


Types of articles
Primary literature:
● Original research articles
● Surveys
● Case report/case studies
● Editorial
Secondary literature:
● Narrative reviews
● Systematic reviews
● Meta-analysis
● Book reviews
● Guidelines
● Commentary
There is also a further distinction:
Research article: provides new knowledge about a topic by showing the results of lab experiments.
Review article: summarizes and evaluates existing knowledge derived from different previous researchers on
the topic.

Variables and descriptive statistics
Methodology: study of the methods used to collect data, make observations and address RQs.

Statistics
Set of mathematical tools that help draw conclusions about a set of data.

, Statistics is used to:
● Describe a sample
● Make inferences about a population
● Answer the RQ

There are 2 types of statistics:
Inferential statistics: use analysis from sample data to make inferences about the total population (establish the
likelihood of our sample data occurring by chance or due to our variable of interest).
Descriptive statistics: mathematical operations (and graphs) that help us summarize our sample data in order to
describe our sample (cannot provide us with any info regarding the population).

Needed to understand the sample because raw data alone can’t help answer the RQ.
There are 3 main measures of descriptive statistics:
1. Frequencies and proportions/percentages
Frequency is the number of times an observation appears in a data set (x)
Proportion/percentages are the number of times an observation appears in a data set relative to
the total number of observations. (x/n)
Categorical and quantitive data, though less informative and overall not that important.
2. Measures of central tendency
A single value that describes where most observations in a dataset are clustered.
a. Mode: value that appears most frequently.
b. Mean: average value.
or
c. Median: value that appears in the middle of the ordered dataset.
d. Modal class: the range of data where the highest number of observations falls (that is the
tallest bin/bar in the histogram). This is used when we try to find the pode of continuous
data.
Categorical and quantitive data.
Why these 3 types of measures are needed:
1. Mean becomes a misleading parameter when data is not symmetrical
2. Mean and Median are often not appropriate measures for categorical data


4. Measured of spread
Only quantitive data.
A single value that describes how spread out the datapoints are.
a. Range and IQR
The range is the difference between the largest and the smallest value.
The IQR (Interquartile Range) is the range between Q1 and Q3 (Q3-Q1) where the middle
50% of the data is found. It is determined by applying the 5-number summary:
- Q0: minimum value
- Q1: lower quartile (median of lower 50% of the data)
- Q2: median of the entire dataset.

Voordelen van het kopen van samenvattingen bij Stuvia op een rij:

Verzekerd van kwaliteit door reviews

Verzekerd van kwaliteit door reviews

Stuvia-klanten hebben meer dan 700.000 samenvattingen beoordeeld. Zo weet je zeker dat je de beste documenten koopt!

Snel en makkelijk kopen

Snel en makkelijk kopen

Je betaalt supersnel en eenmalig met iDeal, creditcard of Stuvia-tegoed voor de samenvatting. Zonder lidmaatschap.

Focus op de essentie

Focus op de essentie

Samenvattingen worden geschreven voor en door anderen. Daarom zijn de samenvattingen altijd betrouwbaar en actueel. Zo kom je snel tot de kern!

Veelgestelde vragen

Wat krijg ik als ik dit document koop?

Je krijgt een PDF, die direct beschikbaar is na je aankoop. Het gekochte document is altijd, overal en oneindig toegankelijk via je profiel.

Tevredenheidsgarantie: hoe werkt dat?

Onze tevredenheidsgarantie zorgt ervoor dat je altijd een studiedocument vindt dat goed bij je past. Je vult een formulier in en onze klantenservice regelt de rest.

Van wie koop ik deze samenvatting?

Stuvia is een marktplaats, je koop dit document dus niet van ons, maar van verkoper baltzievdokia. Stuvia faciliteert de betaling aan de verkoper.

Zit ik meteen vast aan een abonnement?

Nee, je koopt alleen deze samenvatting voor €8,16. Je zit daarna nergens aan vast.

Is Stuvia te vertrouwen?

4,6 sterren op Google & Trustpilot (+1000 reviews)

Afgelopen 30 dagen zijn er 52510 samenvattingen verkocht

Opgericht in 2010, al 14 jaar dé plek om samenvattingen te kopen

Start met verkopen
€8,16
  • (0)
In winkelwagen
Toegevoegd