100% tevredenheidsgarantie Direct beschikbaar na betaling Zowel online als in PDF Je zit nergens aan vast
logo-home
Statistics summary from lecture slides, based mostly on the book of Agresti €5,49
In winkelwagen

Samenvatting

Statistics summary from lecture slides, based mostly on the book of Agresti

 40 keer bekeken  2 keer verkocht

A summary containing the slides based on the material: M&M CH14 M&M CH12.2 (contrasts) CH11 sections 1, 2, 3, 4, 5, 6, 7 CH12 section 1, 2, 3, 4, 5 CH13 sections 1, 2, 4 (Not ‘Multiple comparisons of adjusted means’) CH14 sections 1, 2, 3 CH15 sections 1, 2, 3

Laatste update van het document: 6 maanden geleden

Voorbeeld 3 van de 23  pagina's

  • Nee
  • Ch11 sections 1, 2, 3, 4, 5, 6, 7 & ch12 sections 1, 2, 3, 4, 5 & ch13 sections 1, 2, 4 (not &opencurlyquote;multi
  • 4 juni 2024
  • 9 juni 2024
  • 23
  • 2023/2024
  • Samenvatting
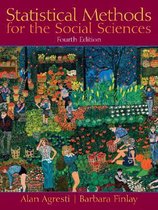
book image

Titel boek:

Auteur(s):

  • Uitgave:
  • ISBN:
  • Druk:
Alle documenten voor dit vak (2)
avatar-seller
mariekeboerendonk
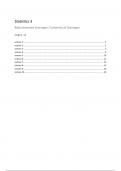
Statistics 3
Rijksuniversiteit Groningen / University of Groningen

PSBE2-12

Lecture 1................................................................................................................................................. 2
Lecture 2................................................................................................................................................. 2
Lecture 3................................................................................................................................................. 5
Lecture 4................................................................................................................................................. 6
Lecture 5............................................................................................................................................... 10
Lecture 6............................................................................................................................................... 11
Lecture 7............................................................................................................................................... 14
Lecture 8............................................................................................................................................... 15
Lecture 9............................................................................................................................................... 18
Lecture 10............................................................................................................................................. 20

,Lecture 1
Model comparison approach → all traditional tests (t-tests, ANOVA, regression) can be reformulated
as model comparisons
→ do more than traditional tests and also prevent p-hacking

Nested models = all terms of a smaller model are also included in a larger model
→ Model 1: 𝑦 = 𝑏0 + 𝑏1𝑥1

→ Model 2: 𝑦 = 𝑏0 + 𝑏1𝑥1 + 𝑏2𝑥2
→ how much do I improve fit if I include 𝑏2𝑥2 into the model, above and beyond what’s already in
the model?

P-value = probability of obtaining test results at least as extreme as the result actually observed,
under the assumption that the null hypothesis is correct
P-hacking = running lots of statistical tests on the same data and reporting only those results that are
significant.
→ better not to use p-values (instead: estimation of effect by use of means, standard deviations,
correlations, effect sizes, cohen’s d, and CI’s OR graphical analysis OR model comparison OR bayesian
statistics)


Lecture 2
Idea of simple linear regression:
1. draw a scatterplot of your bivariate data
2. draw a straight line that comes as close as possible to the points (minimize prediction errors
aka residuals, thus ordinary least squares criterion (OLS))
3. find out what the equation of this straight line is


Straight line: 𝑦 = 𝑏0 + 𝑏1𝑥
𝑠𝑦
𝑏1 = 𝑟 · 𝑠𝑥
and 𝑏0 = 𝑦 − 𝑏𝑥

BOTH ON FORMULA SHEET

Confidence interval to examine the size of the effect
→ CI for the slope parameter β1: 𝑏1 + 𝑡 * 𝑆𝐸(𝑏1) use t-distribution with 𝑑𝑓 = 𝑛 − 2
NOT ON FORMULA SHEET (n - estimated parameters)

Significance test to test whether or not there is an effect
𝑏1
→ test statistic to test if β1 = 0: 𝑡 = 𝑆𝐸(𝑏1)

NOT ON FORMULA SHEET

, Different but equivalent representations of simple linear regression model:
1. Statistical model (population): µ𝑦 = β0 + β1𝑥
2. Statistical model (population): 𝑦 = β0 + β1𝑥 + ε

3. Estimated regression equation (sample): 𝑦 = 𝑏0 + 𝑏1𝑥


Linear regression can be used to describe many such relationships:
1. Simple linear regression: 1 DV & 1 IV
2. Multiple linear regression: 1 DV & multiple IV’s plus possible interactions
3. 1-ANOVA: 1 DV & 1 categorical IV using code variables
4. 2-ANOVA: 1 DV & 2 categorical IV’s using code variables for each factor

Interpreting regression coefficients in:
→ simple linear regression: A slope in bivariate regression describes the effect of that variable on
the response variable
→ multiple linear regression: A slope describes the effect of an explanatory variable while
controlling effects of the other explanatory variables in the model

Multiple linear regression:
𝑠𝑦 𝑠𝑦
𝑏1 = 𝑏1 * · 𝑠1
and 𝑏2 = 𝑏2 * · 𝑠2

𝑏0 = 𝑦 − 𝑏1𝑥1 − 𝑏2𝑥2
Where 𝑏1 * and 𝑏2 * are standardized regression coefficients
𝑟𝑦1−𝑟𝑦2·𝑟12 𝑟𝑦2−𝑟𝑦1·𝑟12
𝑏1 *= 2 and 𝑏2 *= 2
1−𝑟 12
1−𝑟 12

ALL ON FORMULA SHEET

Examining association using multiple linear regression
→ how well do all IVs together explain/estimate y?
→ use multiple R (correlation between y and 𝑦12) and R2 (percentage of explained variance)
2 2
2 𝑟 𝑦1
+𝑟 𝑦2
−2𝑟𝑦1𝑟𝑦2𝑟12 2
𝑅 𝑦·12
= 2 OR 𝑅 𝑦·12
= 𝑏1 * 𝑟𝑦1 + 𝑏2 * 𝑟𝑦2
1−𝑟 12

BOTH ON FORMULA SHEET
2 𝑆𝑆𝑀𝑜𝑑𝑒𝑙
OR 𝑅 = 𝑆𝑆𝑇𝑜𝑡𝑎𝑙
NOT ON FORMULA SHEET


2
a: the unique contribution of 𝑥1to 𝑦 → 𝑠𝑟1
2
c: the unique contribution of 𝑥2to 𝑦 → 𝑠𝑟2
b: the common contribution of 𝑥1and 𝑥2 to 𝑦
e: error: unexplained part of 𝑦

Voordelen van het kopen van samenvattingen bij Stuvia op een rij:

Verzekerd van kwaliteit door reviews

Verzekerd van kwaliteit door reviews

Stuvia-klanten hebben meer dan 700.000 samenvattingen beoordeeld. Zo weet je zeker dat je de beste documenten koopt!

Snel en makkelijk kopen

Snel en makkelijk kopen

Je betaalt supersnel en eenmalig met iDeal, creditcard of Stuvia-tegoed voor de samenvatting. Zonder lidmaatschap.

Focus op de essentie

Focus op de essentie

Samenvattingen worden geschreven voor en door anderen. Daarom zijn de samenvattingen altijd betrouwbaar en actueel. Zo kom je snel tot de kern!

Veelgestelde vragen

Wat krijg ik als ik dit document koop?

Je krijgt een PDF, die direct beschikbaar is na je aankoop. Het gekochte document is altijd, overal en oneindig toegankelijk via je profiel.

Tevredenheidsgarantie: hoe werkt dat?

Onze tevredenheidsgarantie zorgt ervoor dat je altijd een studiedocument vindt dat goed bij je past. Je vult een formulier in en onze klantenservice regelt de rest.

Van wie koop ik deze samenvatting?

Stuvia is een marktplaats, je koop dit document dus niet van ons, maar van verkoper mariekeboerendonk. Stuvia faciliteert de betaling aan de verkoper.

Zit ik meteen vast aan een abonnement?

Nee, je koopt alleen deze samenvatting voor €5,49. Je zit daarna nergens aan vast.

Is Stuvia te vertrouwen?

4,6 sterren op Google & Trustpilot (+1000 reviews)

Afgelopen 30 dagen zijn er 50064 samenvattingen verkocht

Opgericht in 2010, al 14 jaar dé plek om samenvattingen te kopen

Start met verkopen
€5,49  2x  verkocht
  • (0)
In winkelwagen
Toegevoegd