Financial statement analysis involves examining and interpreting a company's financial statements to understand its financial performance and position. This analysis helps in assessing the profitability, liquidity, solvency, and overall health of the business. It typically includes evaluating the i...
Financial Accounting and Analysis
Prof. Padmini Srinivasan
Week 4 and Week 5 Handout
Financial Statement Analysis
Introduction
After understanding the basic financial statements, one may be interested in analysing the financial
statements to understand the performance of the business. Financial statement analysis helps
answer basic questions such as
• How has the business performed during the year
• What is the financial condition of the company
• How investment activities have performed during the year
• Does the company have enough liquidity to meet its day - today operations and
many more
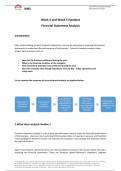
Let us examine the sequence of accounting and analysis as depicted below
Evaluating the Forecasting
Preparation of performance about the Taking steps to
Analyzing the
Finanacial and position of future period address the
Financial
Statements the business and diagnosing problems areas
Statements
using certain the present if any
tools situation
1.What does analysis involve ?
Financial statement analysis is a set of tools and techniques used to assess the financial performance
of the business. Here one must understand that business does not operate in vacuum and therefore
understanding the business context, the industry, the company’s own strategy are important before
we start the analysis.
Apart from financial statements there are several additional inputs in the annual report that aid in
analyzing the financial statements. These are Directors report/Chairman’s statement, Segment
, Financial Accounting and Analysis
Prof. Padmini Srinivasan
Reporting, Companies Risks and mitigation measures, Notes and explanations in the annual report.
Using the additional parts of the annual report the numbers can be interpreted in a better manner.
2. Tools to analysis
Once you develop the basic understanding. We can go to number crunching ie analysis
We start with the following basic tools
• Horizontal Analysis
• Vertical or Common sizing statements and
• Ratio analysis
Let’s elaborate each one:
2.1 Horizontal Analysis & Trend Analysis
The trend analysis is a technique of studying several financial statements over a series of years. In
this analysis the trend percentages are calculated for each item by taking the figure of that item for
the base year taken as 100. Generally, the first year is taken as a base year. This analysis helps in
understanding the trend of figures, whether moving upward or downward. Trend analysis shows
the level of growth that the company has achieved over the years on each component of financial
statements. Suppose the growth rate of sales is 20% but its cost has increased by 26%, then its
profitability is affected. One can perform such analysis by observing the trends on each element in
the balance sheet as well as the income statement.
2.2 Common Sizing
The common size statements (Balance Sheet and Income Statement) are shown in analytical
percentages. The figures of these statements are shown as percentages of total assets, total liabilities
and total income respectively. Take the example of Balance Sheet. The total assets are taken as 100
and different assets are expressed as a percentage of the total. Similarly, various liabilities are taken
as a percentage of total liabilities. In the income statement, the total income is taken as 100 and all
other elements (such as different type of expenses) of the income statement are worked out as a
percentage to the revenue.
Common size statement analysis if performed across several years helps understand the structure of
the company and track the changes in the allocation of assets or liabilities. In the income statement
one can also observe the movement in the various expenses and identify which of the expense
contributed to the change in the net profit compared to the previous year.
Voordelen van het kopen van samenvattingen bij Stuvia op een rij:
Verzekerd van kwaliteit door reviews
Stuvia-klanten hebben meer dan 700.000 samenvattingen beoordeeld. Zo weet je zeker dat je de beste documenten koopt!
Snel en makkelijk kopen
Je betaalt supersnel en eenmalig met iDeal, creditcard of Stuvia-tegoed voor de samenvatting. Zonder lidmaatschap.
Focus op de essentie
Samenvattingen worden geschreven voor en door anderen. Daarom zijn de samenvattingen altijd betrouwbaar en actueel. Zo kom je snel tot de kern!
Veelgestelde vragen
Wat krijg ik als ik dit document koop?
Je krijgt een PDF, die direct beschikbaar is na je aankoop. Het gekochte document is altijd, overal en oneindig toegankelijk via je profiel.
Tevredenheidsgarantie: hoe werkt dat?
Onze tevredenheidsgarantie zorgt ervoor dat je altijd een studiedocument vindt dat goed bij je past. Je vult een formulier in en onze klantenservice regelt de rest.
Van wie koop ik deze samenvatting?
Stuvia is een marktplaats, je koop dit document dus niet van ons, maar van verkoper akash16. Stuvia faciliteert de betaling aan de verkoper.
Zit ik meteen vast aan een abonnement?
Nee, je koopt alleen deze samenvatting voor €6,53. Je zit daarna nergens aan vast.