All relevant, in-debth content for SMCR (Statistical Modelling for Communication Research) exam at UvA. Including book material, class materials, SPSS manuals, examples, and notes from other relevant materials.
Inferential statistics helps us to generalize conclusions; make statements about larger set of
observations
- Offers us a p-value and a CI
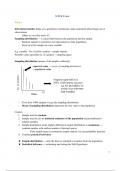
Sampling distribution → a crucial link between the population and the sample
- Random sample is sometimes not representative of the population
- Score of a first sample on a new variable
E.g. variable - No.of yellow candies = sample statistic
Possible values (possible no. of candies) = sampling space
Sampling distribution (means of all samples collected)
- If we draw 1000 samples we get the sampling distribution
- Mean of sampling distribution represents the true value in the population
Caution:
1. Sample must be random
2. Sample must be (is) an unbiased estimator of the population (mean) (unbiased =
random sample)
3. Sample distribution looks slightly different if sample distribution is continuous →
contains number with endless number of decimal spaces
- If the sample mean is continuous sample statistic we use probability densities
4. Consider practical relevance
★ Sample distribution → only the data we sampled to examine from the population
★ Statistical inference → estimating and testing the Null Hypothesis
1
, ★ Sampling space → collection of all possible outcome scores/sample statistic values
★ Sample statistic → a value/number describing characteristics of a sample (e.g. no.of
yellow candies); also called - Random Variable (variable- because different samples
have different scores, that depend on chance?)
- Discrete sample statistics → the sampling distribution tells us the probability of
individual sample outcomes.
- Continuous sample statistics → it tells us the probability density, which gives us the
probability of drawing a sample with an outcome that is at least or at most a particular
value, or an outcome that is between two values.
★ Sampling Distribution → distribution of the outcome scores of very many samples
- all possible sample statistic values + their probabilities (of drawing a particular value and
min and max value) and probability densities
Calculating probability → 26 (e.g. number of samples with 5 yellow candies )/1000 (number of
samples drawn)=0.026 (probability of drawing a sample with 5 yellow candies)
★ Probability Distributions → a sampling space with probabilities
- tells us the probability a particular outcome may occur (0% - 100%); discrete random
variables (a finite value that can be counted)
- A spread of entire population
- Probability distribution of all possible outcomes are 0 because there is infinite no. of
possible values (we can never estimate the exact one)
- Displaying probability as an area between horizontal axis and a curve → probability
density function
★ Probability Density function → gives us the probability of values between two
thresholds AND gives us the probability up to a threshold value = left-hand probability
(used to calculate p-values)
- Determines the shape of a distribution
- A normal distribution has a probability density function
- Getting a probability that a continuous random variable falls within a particular range
- 2 functions of probability distributions:
a) How likely are we to draw a sample with a particular value
b) Finding a threshold values that separate the top 10% or bottom 5% of distribution
Expected value = population proportion x total no. of (things)
Expected value → average/mean of the sampling distribution of a random variable (average of
probability distribution; average of what we are studying)
2
,Cases → things counted; units of analysis
Unbiased estimator (a sample statistic) → when the SAMPLING DISTRIBUTION is equal to
POPULATION VALUE (population distribution) (average of the sampling distribution =
expected value)
- Estimate is downward biased → when it is too low
- Average is unbiased estimator?
Sample is (in principal) representative of population if variables in the sample are distributed
in the same way in the population.
In sampling distribution → Samples are cases (units of analysis) and Sample Characteristics
are observations
- Sampling distribution collects a large number of sampling proportions → the mean of
proportions = sample proportion is an unbiased estimator of sample proportion
- Sample and population consist of same type of observations
Empirical cycle → process of coming up with hypothesis about how stuff works and testing that
hypothesis against empirical data in a systematic way (deductive approach)
- Observation → sparks an idea for new research hypothesis; comes from previous
research; observing population in 1 or more specific instances
- Induction → specific to general statement
- Deduction → expectation/prediction; general to specific statement
- Testing → hypothesis is tested by collecting new data; prediction confirmed or not
- Evaluation → hypothesis is adjusted, rarely rejected; if confirmed - only provides
provisional support (because it can be disproven)
E.g. → experiment: flipping the coin
- Number of heads that we throw relate to the population (normal distribution) under H0:
that nothing is going on (no difference/change)
- We throw 2 times heads - a 20% chance
- H0: there is no difference in the population (difference between sample mean and the
population mean) when we falsify H0 we find support for alternative H
- H1: there is a difference in the population
- When we have a fair coin (50heads-50tails) nothing is going on (static)
- Data that we find (e.g. 2 times heads) is not = to expected value ?
- E.g. no of heads → test statistic
3
, To know what is H0 we have to know what is rare - set Alpha level and power
Binomial (probability) distribution → two states; 1/0; yes/no; discrete variables
Binomial H0: (probability of heads is 0.5)
- E.g. Expected value = 5
- Continuous line
- We assume the coin is fair
- But we cannot ever conclude that there is an unfair coin based on only throwing 2 times
heads
- We can set premises and boundaries to get a conclusion but that is NOT real → we know
for sure - but we can estimate a % of how sure we can be
- Putting a cut-off point (boundaries) determines how sure we are
- Acceptable probability to make mistake (5%)
Binomial H1: E.g. expected value is not 5, but rather 0.25
e.g the value is within the 95% range (more than a 5% chance)
4
Voordelen van het kopen van samenvattingen bij Stuvia op een rij:
Verzekerd van kwaliteit door reviews
Stuvia-klanten hebben meer dan 700.000 samenvattingen beoordeeld. Zo weet je zeker dat je de beste documenten koopt!
Snel en makkelijk kopen
Je betaalt supersnel en eenmalig met iDeal, creditcard of Stuvia-tegoed voor de samenvatting. Zonder lidmaatschap.
Focus op de essentie
Samenvattingen worden geschreven voor en door anderen. Daarom zijn de samenvattingen altijd betrouwbaar en actueel. Zo kom je snel tot de kern!
Veelgestelde vragen
Wat krijg ik als ik dit document koop?
Je krijgt een PDF, die direct beschikbaar is na je aankoop. Het gekochte document is altijd, overal en oneindig toegankelijk via je profiel.
Tevredenheidsgarantie: hoe werkt dat?
Onze tevredenheidsgarantie zorgt ervoor dat je altijd een studiedocument vindt dat goed bij je past. Je vult een formulier in en onze klantenservice regelt de rest.
Van wie koop ik deze samenvatting?
Stuvia is een marktplaats, je koop dit document dus niet van ons, maar van verkoper kaivainomaa. Stuvia faciliteert de betaling aan de verkoper.
Zit ik meteen vast aan een abonnement?
Nee, je koopt alleen deze samenvatting voor €15,06. Je zit daarna nergens aan vast.