100% tevredenheidsgarantie Direct beschikbaar na je betaling Lees online óf als PDF Geen vaste maandelijkse kosten
logo-home
BSAN 160 Test 2 Questions with Correct Answers €13,30
In winkelwagen

Tentamen (uitwerkingen)

BSAN 160 Test 2 Questions with Correct Answers

 0 keer verkocht
  • Vak
  • BSAN 160
  • Instelling
  • BSAN 160

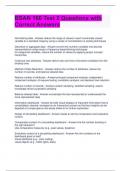
BSAN 160 Test 2 Questions with Correct Answers Normalizing data - Answer-reduce the range of values in each numerically valued variable to a standard range by using a variety of normalization or scaling techniques Discretize or aggregate data - Answer-convert the numeric variables into discret...

[Meer zien]
Voorbeeld 2 van de 11  pagina's

  • 16 augustus 2024
  • 11
  • 2024/2025
  • Tentamen (uitwerkingen)
  • Vragen en antwoorden
  • BSAN 160
  • BSAN 160
avatar-seller
BSAN 160 Test 2 Questions with
Correct Answers

Normalizing data - Answer-reduce the range of values in each numerically valued
variable to a standard range by using a variety of normalization or scaling techniques

Discretize or aggregate data - Answer-convert the numeric variables into discrete
representations using range or frequency based binning techniques
for categorical variables, reduce the number of values by applying proper concept
hierarchies

Construct new attributes - Answer-derive new and more informative variables from the
existing ones

Method of Data Reduction - Answer-reduce the number of attributes, reduce the
number of records, and balance skewed data

Reduce number of attributes - Answer-principal component analysis, independent
component analysis, chi-square testing, correlation analysis, and decision tree induction

Reduce number of records - Answer-random sampling, stratified sampling, expert-
knowledge-driven purposeful sampling

Balance skewed data - Answer-oversample the less represented or undersample the
more represented class

Information dashboard - Answer-provide visual displays of important information that is
consolidated, cleaned, arranged on an (interactive) screen so that key insights can be
digested at a single glance and easily drilled in for further exploration

Design of storytelling dashboard - Answer-needs to set the comparative and evaluative
context

Comparative context of a storytelling dashboard - Answer-Are the number trending in
the right direction?
Use comparative measures (e.g., past values, baseline)

Evaluative context of a storytelling dashboard - Answer-Are the numbers on the
dashboard good or bad?
Visual attributes (e.g., color-coding)
visual objects (e.g., traffic lights, dials)

, Descriptive statistics - Answer-Describe the sample data at hand (central tendency
measures, spread, shape)

Inferential statistics - Answer-about drawing inferences about the characteristics of a
population using a sample from that population

Regression - Answer-used to examine the relationship between one or more
explanatory variables (input, independent) and one or more response variables (output,
dependent)

Uses of regression - Answer-forecasting values of a dependent variable (most frequent
use)
to test hypotheses

Simple linear regression - Answer-has only one input variable

Optimal line - Answer-closest to all the data points, gives the "best fit' and should
capture the trend

Regression model equation - Answer-

Multiple linear regression - Answer-one numerical dependent variable and more than
one independent variable, which can be numerical or categorical

use of a scatterplot in data assessment - Answer-visualize the relationship between
dependent and independent variables

Descriptive Analytics - Answer-What happened?
What is happening?

Predictive Analytics - Answer-What will happen?
Why will it happen?

Prescriptive Analytics - Answer-What should I do?
Why should I do it?
Compares different actions/decisions and selects the best decisions based on certain
performance criteria

When does data become information? - Answer-After it is processed

Is data absolute facts? - Answer-No, real-world data comes with uncertainty, nuances,
and biases

Structured data - Answer-organized as data arrays (e.g., spreadsheets) with variables,
observations, and values

Dit zijn jouw voordelen als je samenvattingen koopt bij Stuvia:

Bewezen kwaliteit door reviews

Bewezen kwaliteit door reviews

Studenten hebben al meer dan 850.000 samenvattingen beoordeeld. Zo weet jij zeker dat je de beste keuze maakt!

In een paar klikken geregeld

In een paar klikken geregeld

Geen gedoe — betaal gewoon eenmalig met iDeal, creditcard of je Stuvia-tegoed en je bent klaar. Geen abonnement nodig.

Direct to-the-point

Direct to-the-point

Studenten maken samenvattingen voor studenten. Dat betekent: actuele inhoud waar jij écht wat aan hebt. Geen overbodige details!

Veelgestelde vragen

Wat krijg ik als ik dit document koop?

Je krijgt een PDF, die direct beschikbaar is na je aankoop. Het gekochte document is altijd, overal en oneindig toegankelijk via je profiel.

Tevredenheidsgarantie: hoe werkt dat?

Onze tevredenheidsgarantie zorgt ervoor dat je altijd een studiedocument vindt dat goed bij je past. Je vult een formulier in en onze klantenservice regelt de rest.

Van wie koop ik deze samenvatting?

Stuvia is een marktplaats, je koop dit document dus niet van ons, maar van verkoper Perfectscorer. Stuvia faciliteert de betaling aan de verkoper.

Zit ik meteen vast aan een abonnement?

Nee, je koopt alleen deze samenvatting voor €13,30. Je zit daarna nergens aan vast.

Is Stuvia te vertrouwen?

4,6 sterren op Google & Trustpilot (+1000 reviews)

Afgelopen 30 dagen zijn er 69411 samenvattingen verkocht

Opgericht in 2010, al 15 jaar dé plek om samenvattingen te kopen

Begin nu gratis
€13,30
  • (0)
In winkelwagen
Toegevoegd