100% tevredenheidsgarantie Direct beschikbaar na je betaling Lees online óf als PDF Geen vaste maandelijkse kosten
logo-home
Six Sigma Green Belt Exam Final Questions with Verified Answers €12,27
In winkelwagen

Tentamen (uitwerkingen)

Six Sigma Green Belt Exam Final Questions with Verified Answers

 0 keer verkocht
  • Vak
  • Six Sigma Green Belt
  • Instelling
  • Six Sigma Green Belt

______ is a technique for understanding the relationship between many input variables of a process and one outcome variable. - Multiple regression - Scatter plot - MANOVA - Answer-Multiple Regression ______ is a technique for understanding the relationship between many input variables of a ...

[Meer zien]
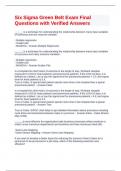
Voorbeeld 2 van de 9  pagina's

  • 10 september 2024
  • 9
  • 2024/2025
  • Tentamen (uitwerkingen)
  • Vragen en antwoorden
  • Six Sigma Green Belt
  • Six Sigma Green Belt
avatar-seller
Six Sigma Green Belt Exam Final
Questions with Verified Answers
______ is a technique for understanding the relationship between many input variables
of a process and one outcome variable.

- Multiple regression
- Scatter plot
- MANOVA - Answer-Multiple Regression

______ is a technique for understanding the relationship between many input variables
of a process and many outcome variables.

- Multiple regression
- Scatter plot
- MANOVA - Answer-Scatter Plot

In a hospital the chief metric of outcome is the length of stay. Richland Hospital
measured it LOS for heart patients and pneumonia patients. If the LOS>10 days, it is
defined as a defect. Let us say the sigma level for pneumonia patients = 2.5; and sigma
level for heart patients is 3.5.
True or False: A typical heart patient spends more time in the hospital than a typical
pneumonia patient. - Answer-False

In a hospital the chief metric of outcome is the length of stay. Richland Hospital
measured it LOS for heart patients and pneumonia patients. If the LOS>10 days, it is
defined as a defect. Let us say the sigma level for pneumonia patients = 4.5; and sigma
level for heart patients is 2.0.
True or False: A typical heart patient spends more time in the hospital than a typical
pneumonia patient. - Answer-True

True or False: SIPOC chart helps to get detailed information about processes including
cycle times and inventories between steps in a process. - Answer-False - Value Stream
Map (VSM)

______is most effective for organization-wide business processes where products or
orders cross numerous departments and locations and have numerous hand-offs.

-Swim-Lane Mapping
-Value Stream Mapping - Answer-Swim-Lane Mapping

If you want to develop a better layout for reducing the amount of time it takes for a
typical job to be processed in a job-shop, which of the following would be most
effective?

, -SIPOC Chart
-Value-Stream Map
-Spaghetti Diagram
-Swim-Lane Chart - Answer-Spaghetti Diagram

. The process analysis approach that incorporates specifically the dynamic and
uncertain interactions between resources and customers during the process is:

-Statistical Process Control
-Value-Stream Mapping
-Process Simulation Modeling
-Kano Analysis - Answer-Process Simulation Modeling

Consider the following data conducted by Columbia Restaurants Association on
customer wait times at various fast food restaurants (minutes). We own two restaurants:
one in Vista and one in Five-Points, and following are results for the two locations:
Vista:
- Median = 10,
- 25th percentile = 7,
- 75th percentile = 12
Five-Points:
- Median = 7,
- 25th percentile = 4,
- 75th percentile = 13
Which restaurant should you visit if you want a more predictable service (measured by
wait time)? - Answer-Vista
- the IQR is much smaller for this location so it is more predictable.
(12-7 is less than 13-4)

Which control chart would you develop for tracking the "number of customers" who were
"dissatisfied" with your customer service call center experience by sampling "exactly 50
customers" every day and asking the "Yes (satisfied) / No (dissatisfied)" question?

- U-Chart
- np-Chart
- X-bar and R Chart - Answer-np-chart

Customers at a particular Taco Bell location have been complaining that they are
shortchanged on the amount of beans actually filled in the burritos (sometimes as low
as 3oz.). Taco Bell has a standard which says each burrito must have an average 8oz.
beans with an upper and lower control liming of 6 and 11oz. Which control chart(s)
would you develop for tracking the variation in amount of beans filled at this location?

- X-bar and R Charts
- C-Chart

Dit zijn jouw voordelen als je samenvattingen koopt bij Stuvia:

Bewezen kwaliteit door reviews

Bewezen kwaliteit door reviews

Studenten hebben al meer dan 850.000 samenvattingen beoordeeld. Zo weet jij zeker dat je de beste keuze maakt!

In een paar klikken geregeld

In een paar klikken geregeld

Geen gedoe — betaal gewoon eenmalig met iDeal, creditcard of je Stuvia-tegoed en je bent klaar. Geen abonnement nodig.

Direct to-the-point

Direct to-the-point

Studenten maken samenvattingen voor studenten. Dat betekent: actuele inhoud waar jij écht wat aan hebt. Geen overbodige details!

Veelgestelde vragen

Wat krijg ik als ik dit document koop?

Je krijgt een PDF, die direct beschikbaar is na je aankoop. Het gekochte document is altijd, overal en oneindig toegankelijk via je profiel.

Tevredenheidsgarantie: hoe werkt dat?

Onze tevredenheidsgarantie zorgt ervoor dat je altijd een studiedocument vindt dat goed bij je past. Je vult een formulier in en onze klantenservice regelt de rest.

Van wie koop ik deze samenvatting?

Stuvia is een marktplaats, je koop dit document dus niet van ons, maar van verkoper lectknancy. Stuvia faciliteert de betaling aan de verkoper.

Zit ik meteen vast aan een abonnement?

Nee, je koopt alleen deze samenvatting voor €12,27. Je zit daarna nergens aan vast.

Is Stuvia te vertrouwen?

4,6 sterren op Google & Trustpilot (+1000 reviews)

Afgelopen 30 dagen zijn er 69052 samenvattingen verkocht

Opgericht in 2010, al 15 jaar dé plek om samenvattingen te kopen

Begin nu gratis

Laatst bekeken door jou


€12,27
  • (0)
In winkelwagen
Toegevoegd