100% tevredenheidsgarantie Direct beschikbaar na betaling Zowel online als in PDF Je zit nergens aan vast
logo-home
TURNING DATA INTO INFORMATION USING ArcGIS 10 ESRI ONLINE TUTORIAL EXAM €11,38   In winkelwagen

Tentamen (uitwerkingen)

TURNING DATA INTO INFORMATION USING ArcGIS 10 ESRI ONLINE TUTORIAL EXAM

 8 keer bekeken  0 keer verkocht
  • Vak
  • TURNING DATA INTO INFORMATION USING ArcGIS 10 ESRI
  • Instelling
  • TURNING DATA INTO INFORMATION USING ArcGIS 10 ESRI

TURNING DATA INTO INFORMATION USING ArcGIS 10 ESRI ONLINE TUTORIAL EXAM ...

Voorbeeld 3 van de 16  pagina's

  • 24 september 2024
  • 16
  • 2024/2025
  • Tentamen (uitwerkingen)
  • Onbekend
  • TURNING DATA INTO INFORMATION USING ArcGIS 10 ESRI
  • TURNING DATA INTO INFORMATION USING ArcGIS 10 ESRI
avatar-seller
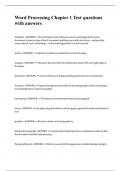
What is the fundamental problem with representing geographic data? -
ANSWER The world is infinitely complex, so any digital representation of
geographic phenomena is inherently incomplete.

Name the six types of spatial analysis. - ANSWER Six types of spatial
analysis are queries and reasoning, measurements, transformations,
descriptive summaries, optimization, and hypothesis testing.

Describe uncertainty associated with the raster data model. - ANSWER
In the raster data model, spatial objects are defined as a set of
contiguous cells with the same value. Because an individual cell may
store only one value, but in reality there may be a mix of values in the
area represented by the cell, the raster data model can distort the shape
of spatial objects.

discrete object view - ANSWER A way of representing geography in
which the world is represented as objects with well defined boundaries in
empty space. In the discrete object view, geographic objects have
dimensionality and can be counted.

ecological fallacy - ANSWER The assumption that an overall
characteristic of a zone is also a characteristic of any location or
individual within the zone.

field view - ANSWER A way of representing geography in which the
world is represented as a continuous surface made up of a finite number
of variables, each one defined at every possible position. Fields can be
distinguished by what varies and how smoothly.

,Modifiable Areal Unit Problem (MAUP) - ANSWER A problem in spatial
analysis that occurs when artificial units of reporting, such as
administrative or political boundaries, are superimposed on continuous
phenomena, resulting in the creation of artificial spatial patterns.

raster - ANSWER 1. A spatial data model that defines space as an array
of equally sized cells arranged in rows and columns, and composed of
single or multiple bands. Each cell contains an attribute value and
location coordinates. Unlike a vector structure, which stores coordinates
explicitly, raster coordinates are contained in the ordering of the matrix.
Groups of cells that share the same value represent the same type of
geographic feature.
2. In ArcGIS, an in-memory representation of a raster dataset. A raster
may exist in memory as a subset of a raster dataset; it may have a
different cell size than the raster dataset; or it may exist using a different
transformation than the raster dataset.

spatial analysis - ANSWER The study of the locations and shapes of
geographic features and the relationships between them. Spatial
analysis is useful when evaluating suitability, when making predictions,
and for gaining a better understanding of how geographic features and
phenomena are located and distributed.

spatial autocorrelation - ANSWER A statistical measure that describes
the extent to which the value of an attribute at geographically referenced
points changes as a function of the distance and orientation between
them.

spatial interpolation - ANSWER The estimation of surface values at
unsampled points based on known surface values of surrounding points.
Spatial interpolation can be used to estimate elevation, rainfall,
temperature, chemical dispersion, or other spatially-based phenomena.
Spatial interpolation is commonly a raster operation, but it can also be
done in a vector environment using a TIN surface model. There are
several well-known interpolation techniques, including inverse distance
weighted and kriging.

, vector - ANSWER 1. A coordinate-based data model that represents
geographic features as points, lines, and polygons. Each point feature is
represented as a single coordinate pair, while line and polygon features
are represented as ordered lists of vertices. Attributes are associated
with each vector feature, as opposed to a raster data model, which
associates attributes with grid cells.
2. Any quantity that has both magnitude and direction.

lattice - ANSWER A representation of a surface using an array of
regularly spaced sample points (mesh points) that are referenced to a
common origin and have a constant sampling distance in the x and y
directions. Each mesh point contains the z-value at that location, which
is referenced to a common base z-value, such as sea level. Z-values for
locations between lattice mesh points can be approximated by
interpolation based on neighboring mesh points.

What are the six advantages that GIS maps have over paper maps? -
ANSWER The six advantages of GIS maps over paper maps are
variable scale, variable extent, animation, 3-D, supplementation, and
customization.

Name the four basic classification schemes available in ArcGIS. -
ANSWER Four basic classification schemes are natural breaks, quantile
breaks, equal interval breaks, and standard deviation breaks.

Describe the three principle purposes of scientific visualization. -
ANSWER The three principle purposes of visualization are
interpretation, validation, and exploration. Interpretation enables the user
to understand the message of the spatial and attribute data of a
representation in an intelligible manner. Validation enables the user to
understand the likely overall quality of the representation. Exploration
establishes whether and to what extent the general message of the data
is sensitive to inclusion or exclusion of particular data elements.

cartogram - ANSWER A diagram or abstract map in which geographical
areas are distorted proportionally to the value of an attribute.

Voordelen van het kopen van samenvattingen bij Stuvia op een rij:

Verzekerd van kwaliteit door reviews

Verzekerd van kwaliteit door reviews

Stuvia-klanten hebben meer dan 700.000 samenvattingen beoordeeld. Zo weet je zeker dat je de beste documenten koopt!

Snel en makkelijk kopen

Snel en makkelijk kopen

Je betaalt supersnel en eenmalig met iDeal, creditcard of Stuvia-tegoed voor de samenvatting. Zonder lidmaatschap.

Focus op de essentie

Focus op de essentie

Samenvattingen worden geschreven voor en door anderen. Daarom zijn de samenvattingen altijd betrouwbaar en actueel. Zo kom je snel tot de kern!

Veelgestelde vragen

Wat krijg ik als ik dit document koop?

Je krijgt een PDF, die direct beschikbaar is na je aankoop. Het gekochte document is altijd, overal en oneindig toegankelijk via je profiel.

Tevredenheidsgarantie: hoe werkt dat?

Onze tevredenheidsgarantie zorgt ervoor dat je altijd een studiedocument vindt dat goed bij je past. Je vult een formulier in en onze klantenservice regelt de rest.

Van wie koop ik deze samenvatting?

Stuvia is een marktplaats, je koop dit document dus niet van ons, maar van verkoper luzlinkuz. Stuvia faciliteert de betaling aan de verkoper.

Zit ik meteen vast aan een abonnement?

Nee, je koopt alleen deze samenvatting voor €11,38. Je zit daarna nergens aan vast.

Is Stuvia te vertrouwen?

4,6 sterren op Google & Trustpilot (+1000 reviews)

Afgelopen 30 dagen zijn er 71498 samenvattingen verkocht

Opgericht in 2010, al 14 jaar dé plek om samenvattingen te kopen
Start met verkopen

Laatst bekeken door jou


€11,38
  • (0)
  Kopen