100% tevredenheidsgarantie Direct beschikbaar na betaling Zowel online als in PDF Je zit nergens aan vast
Eerder door jou gezocht
visual analysis of graphed data is the cornerstone of and most frequently used data analysis method in SCD research, particularly for determining whether a study demonstrates experimental control. involves systematic procedures used to evaluate specif€12,78
In winkelwagen
visual analysis of graphed data is the cornerstone of and most frequently used data analysis method in SCD research, particularly for determining whether a study demonstrates experimental control. involves systematic procedures used to evaluate specif
6 keer bekeken 0 keer verkocht
Vak
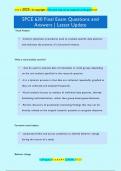
SPCE 630
Instelling
SPCE 630
Visual Analysis
Involves systematic procedures used to evaluate specific data patterns
and evaluates the presence of a functional relation.
What is visual analysis used for?
-Can be used to evaluate data of individuals or small groups depending
on the unit analysis specified in the researc...
✓ Predictability and consistency of data values within a condition or lack of
fluctuations in adjacent.
The objective of between conditions visual analysis (conditions analysis)
✓ To identify if behavior change has occurred
Functional relations
✓ Unequivocal demonstrations that an independent variable (intervention)
produced reliable and consistent change in a dependent variable (target
behavior)
Immediacy of change across adjacent conditions
✓ The degree to which behavior change occurs as soon as the intervention
is introduced.
Overlap
✓ Refers to the values of data in one condition that are in the same range
of values of the data in the subsequent adjacent condition.
1 | P a g e | G r a d e A + | 2 0 0 2 5
Voordelen van het kopen van samenvattingen bij Stuvia op een rij:
Verzekerd van kwaliteit door reviews
Stuvia-klanten hebben meer dan 700.000 samenvattingen beoordeeld. Zo weet je zeker dat je de beste documenten koopt!
Snel en makkelijk kopen
Je betaalt supersnel en eenmalig met iDeal, creditcard of Stuvia-tegoed voor de samenvatting. Zonder lidmaatschap.
Focus op de essentie
Samenvattingen worden geschreven voor en door anderen. Daarom zijn de samenvattingen altijd betrouwbaar en actueel. Zo kom je snel tot de kern!
Veelgestelde vragen
Wat krijg ik als ik dit document koop?
Je krijgt een PDF, die direct beschikbaar is na je aankoop. Het gekochte document is altijd, overal en oneindig toegankelijk via je profiel.
Tevredenheidsgarantie: hoe werkt dat?
Onze tevredenheidsgarantie zorgt ervoor dat je altijd een studiedocument vindt dat goed bij je past. Je vult een formulier in en onze klantenservice regelt de rest.
Van wie koop ik deze samenvatting?
Stuvia is een marktplaats, je koop dit document dus niet van ons, maar van verkoper TestTrackers. Stuvia faciliteert de betaling aan de verkoper.
Zit ik meteen vast aan een abonnement?
Nee, je koopt alleen deze samenvatting voor €12,78. Je zit daarna nergens aan vast.