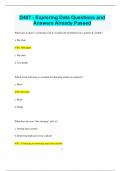
D467 - Exploring Data Questions and Answers Already Passed
16 keer bekeken 0 keer verkocht
Vak
D467 - Exploring Data
Instelling
D467 - Exploring Data
D467 - Exploring Data Questions and
Answers Already Passed
What type of chart is commonly used to visualize the distribution of a numerical variable?
a. Bar chart
b. Histogram
c. Pie chart
d. Line graph
Which of the following is a method for detecting outliers in a dataset?
a. Mea...
D467 - Exploring Data Questions and
Answers Already Passed
What type of chart is commonly used to visualize the distribution of a numerical variable?
a. Bar chart
✔✔b. Histogram
c. Pie chart
d. Line graph
Which of the following is a method for detecting outliers in a dataset?
a. Mean
✔✔b. Box plot
c. Mode
d. Range
What does the term "data cleaning" refer to?
a. Storing data securely
b. Removing duplicates from a dataset
✔✔c. Correcting or removing inaccurate records
1
,d. Formatting data for presentation
What type of analysis focuses on the relationships between multiple variables?
✔✔a. Multivariate analysis
b. Univariate analysis
c. Bivariate analysis
d. Descriptive analysis
What is a key feature of a scatter plot?
a. It shows the frequency of categorical data
b. It displays data trends over time
✔✔c. It represents the relationship between two quantitative variables
d. It summarizes the central tendency of a dataset
Which statistical measure represents the average value of a dataset?
✔✔a. Mean
b. Median
c. Mode
2
,d. Range
What does a correlation coefficient indicate?
a. The size of the dataset
✔✔b. The strength and direction of a linear relationship between two variables
c. The central tendency of data
d. The number of outliers in a dataset
Which of the following is an example of qualitative data?
a. Age of respondents
✔✔b. Eye color of participants
c. Height measurements
d. Sales figures
What is the purpose of data visualization in exploratory analysis?
a. To create data models
✔✔b. To present data in a way that highlights patterns and insights
c. To clean the dataset
3
, d. To calculate statistics
What is the significance of a box plot?
✔✔a. It shows the distribution of data based on five summary statistics
b. It compares means across groups
c. It visualizes time-series data
d. It displays correlation coefficients
How can you assess the normality of a dataset?
a. By calculating the median
✔✔b. By using a Q-Q plot or Shapiro-Wilk test
c. By calculating the mean
d. By creating a histogram only
What role does data aggregation play in exploratory data analysis?
a. It visualizes raw data points
✔✔b. It summarizes data to identify trends and patterns
c. It cleans the data
4
Voordelen van het kopen van samenvattingen bij Stuvia op een rij:
Verzekerd van kwaliteit door reviews
Stuvia-klanten hebben meer dan 700.000 samenvattingen beoordeeld. Zo weet je zeker dat je de beste documenten koopt!
Snel en makkelijk kopen
Je betaalt supersnel en eenmalig met iDeal, creditcard of Stuvia-tegoed voor de samenvatting. Zonder lidmaatschap.
Focus op de essentie
Samenvattingen worden geschreven voor en door anderen. Daarom zijn de samenvattingen altijd betrouwbaar en actueel. Zo kom je snel tot de kern!
Veelgestelde vragen
Wat krijg ik als ik dit document koop?
Je krijgt een PDF, die direct beschikbaar is na je aankoop. Het gekochte document is altijd, overal en oneindig toegankelijk via je profiel.
Tevredenheidsgarantie: hoe werkt dat?
Onze tevredenheidsgarantie zorgt ervoor dat je altijd een studiedocument vindt dat goed bij je past. Je vult een formulier in en onze klantenservice regelt de rest.
Van wie koop ik deze samenvatting?
Stuvia is een marktplaats, je koop dit document dus niet van ons, maar van verkoper BrilliantScores. Stuvia faciliteert de betaling aan de verkoper.
Zit ik meteen vast aan een abonnement?
Nee, je koopt alleen deze samenvatting voor €11,69. Je zit daarna nergens aan vast.