100% tevredenheidsgarantie Direct beschikbaar na je betaling Lees online óf als PDF Geen vaste maandelijkse kosten
logo-home
Solutions For Advanced and Multivariate Statistical Methods,With Questions & Correct Answers | solutions A+. €17,74
In winkelwagen

Tentamen (uitwerkingen)

Solutions For Advanced and Multivariate Statistical Methods,With Questions & Correct Answers | solutions A+.

 0 keer verkocht
  • Vak
  • Advanced and Multivariate
  • Instelling
  • Advanced And Multivariate

Solutions For Advanced and Multivariate Statistical Methods,With Questions & Correct Answers | solutions A+. ANOVA - CORRECT ANSWERS -independent t-test when there are more than 2 groups - are the means different between the groups?; null hypothesis: The populations have the same mean (and by e...

[Meer zien]
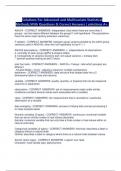
Voorbeeld 2 van de 6  pagina's

  • 1 oktober 2024
  • 6
  • 2024/2025
  • Tentamen (uitwerkingen)
  • Vragen en antwoorden
  • Advanced and Multivariate
  • Advanced and Multivariate
avatar-seller
Solutions For Advanced and Multivariate Statistical
Methods,With Questions & Correct Answers | solutions A+.
ANOVA - CORRECT ANSWERS -independent t-test when there are more than 2
groups - are the means different between the groups?; null hypothesis: The populations
have the same mean (and by extension variannce)

F statistic - CORRECT ANSWERS -between group variance divided by the within group
variance (used in ANOVA); when the null hypothesis is true F = 1

ANVOA assumptions - CORRECT ANSWERS -1. independence of observations
2. normality of each group (qqPlot & shapiro-willks)
3. homogeneity of variance (levene's test; non-equal variance = oneway test)
** perform posthoc testing as well (Tukey)

post hoc tests - CORRECT ANSWERS -- ANOVA = Tukeys - tells which group(s) are
different
- Kruskal Wallis = Dunn - adjusts p-values for multiple comparisons
dataframe - CORRECT ANSWERS -data structure that shapes data into a 2
dimensional table of rows and columns

variable - CORRECT ANSWERS -quality, quantity, or property that can be measured
(columns in dataframe)

observation - CORRECT ANSWERS -set of measurements made under similar
conditions (contains several values each associated with a variable)

value - CORRECT ANSWERS -the measurement that is recorded or a particular
observation of a variable

data wrangling - CORRECT ANSWERS -process of tidying data and pre-processing it
to make analysis easier

Numeric variables (2 types) - CORRECT ANSWERS -continuous: numerical variable
that can be an infinite number of real values (decimals)
discrete: numerical variable that can only take a finite number of real values within an
interval (intervals)

Categorical variables (2 types) - CORRECT ANSWERS -Nominal: describes a label or
category without a natural order
Ordinal: describes a label or category where there is a natural order between values

Atomic vector types - CORRECT ANSWERS -Logical: true, false
Character: most flexible type, alphanumeric

, Numeric vector types - CORRECT ANSWERS -integer: whole numbers
double: decimal numbers

summary statistics - CORRECT ANSWERS -produce measures of central tendency &
measures of spread/dispersion; mean & stdev OR median and IQR if not normally
distributed

mean vs median (measures of central tendency) - CORRECT ANSWERS -median
more robust to outliers and/or extreme values (particularly with small sample sizes)

measures of dispersion - CORRECT ANSWERS -range, variance, standard deviation,
interquartile range, coefficient of variation (measure the spread of the data)

data science pipeline - CORRECT ANSWERS -import - tidy - transform - visualize -
model - communicate

Why use a bar plot - CORRECT ANSWERS -for a single discrete variable (count x axis,
category y)

why use a histogram? - CORRECT ANSWERS -for a single continuous variable (count
x variable, y measurement variable)

why use scatterplots - CORRECT ANSWERS -two continuous variables

why box plots - CORRECT ANSWERS -one continuous (y axis) and one discrete
variable (x axis)

why violin plot? - CORRECT ANSWERS -box plots that show density distribution of the
data

why raincloud plot - CORRECT ANSWERS -violin plots and show the data points as
well

the normal curve - CORRECT ANSWERS -symmetrical distribution about the mean;
mean, median, and mode are the same; mean = 0. sd = 1; most scores near the middle

Normal curve (percentage distributions) - CORRECT ANSWERS -1 sd = 34% (68%
data); 2 sd = 13.5% (95% data); 3 sd = 2.35 % (99.7% data); 4 sd = 0.15% (100% data)

z-score - CORRECT ANSWERS -quantifies standardized deviation from the mean for a
single individual; z = (x-mu)/sd; can be used to calculate the percentage of distribution
below and above a z-score or between 2 z-scores

population - CORRECT ANSWERS -entire groups of people/subjects a researcher
intends their results to apply to

Dit zijn jouw voordelen als je samenvattingen koopt bij Stuvia:

Bewezen kwaliteit door reviews

Bewezen kwaliteit door reviews

Studenten hebben al meer dan 850.000 samenvattingen beoordeeld. Zo weet jij zeker dat je de beste keuze maakt!

In een paar klikken geregeld

In een paar klikken geregeld

Geen gedoe — betaal gewoon eenmalig met iDeal, creditcard of je Stuvia-tegoed en je bent klaar. Geen abonnement nodig.

Direct to-the-point

Direct to-the-point

Studenten maken samenvattingen voor studenten. Dat betekent: actuele inhoud waar jij écht wat aan hebt. Geen overbodige details!

Veelgestelde vragen

Wat krijg ik als ik dit document koop?

Je krijgt een PDF, die direct beschikbaar is na je aankoop. Het gekochte document is altijd, overal en oneindig toegankelijk via je profiel.

Tevredenheidsgarantie: hoe werkt dat?

Onze tevredenheidsgarantie zorgt ervoor dat je altijd een studiedocument vindt dat goed bij je past. Je vult een formulier in en onze klantenservice regelt de rest.

Van wie koop ik deze samenvatting?

Stuvia is een marktplaats, je koop dit document dus niet van ons, maar van verkoper gideonngari. Stuvia faciliteert de betaling aan de verkoper.

Zit ik meteen vast aan een abonnement?

Nee, je koopt alleen deze samenvatting voor €17,74. Je zit daarna nergens aan vast.

Is Stuvia te vertrouwen?

4,6 sterren op Google & Trustpilot (+1000 reviews)

Afgelopen 30 dagen zijn er 69411 samenvattingen verkocht

Opgericht in 2010, al 15 jaar dé plek om samenvattingen te kopen

Begin nu gratis

Laatst bekeken door jou


€17,74
  • (0)
In winkelwagen
Toegevoegd