100% tevredenheidsgarantie Direct beschikbaar na betaling Zowel online als in PDF Je zit nergens aan vast
logo-home
Lecture Note - TBCB - week 2 €3,99   In winkelwagen

College aantekeningen

Lecture Note - TBCB - week 2

 24 keer bekeken  0 keer verkocht

Lectures included: bioinformatics, genomic data analysis (class discovery), tumor metabolism, tumor-stroma interaction, tumor angiogenesis & hypoxia, glioma & angiogenesis, CT colonography, cancer dissemination, circulating tumor cells, MRD detection (hematological malignancy), liquid biopsy,

Voorbeeld 4 van de 38  pagina's

  • 9 januari 2020
  • 38
  • 2018/2019
  • College aantekeningen
  • Onbekend
  • Alle colleges
Alle documenten voor dit vak (7)
avatar-seller
oddsters
Week 2: Tumor Biology and Clinical Behaviour

LECTURE 11: BIOINFORMATICS INTRO TO PRACTICAL WORK (D. Sie) Monday, 05/11/2018

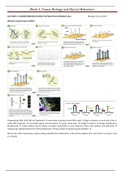
Illumina sequencing workflow


Fragmenting DNA (100-500 bp fragments)  sonication (creating frayed DNA ends)  ligate adapters to each end of the A-
tailed DNA fragment  electropherogram interpretation  cluster generation  bridge formation  bridge amplification
(isothermal)  create millions dense cluster of single strand DNA in each channel of flow cells (primer still attached) 
sequencing (adding terminator & DNA polymerase)  base calling  sequencing by synthesis 

Paired end reads sequencing: require bridge amplification, followed by a flip of the template (for reads that’s too long to read
as a whole)

, Week 2: Tumor Biology and Clinical Behaviour

FASTQ file

1st line: specific cluster being analyzed in the flow cell

a. @Machine name_ f. Cluster X coordinate:
b. Run number_ g. Cluster Y coordinate#
c. Flow cell ID: h. Multiplex barcode/
d. Lane: i. Read number
e. Tile:
2nd line: sequence of 50 nucleotide (example  25-150 nt depending on the machine; limitation: relatively short reads)

3rd line:

a. Quality record indicator (+)
b. Description (a-i of first line)

4th line: ASCII representation of Phred score  probability of the base call being wrong

3 (B) to 40 (H)  B = 3 = 0.40, H = 40 = 0.000 1 (good result: dominant H)

Phred score: (see slide)  determines accuracy of the base called

FASTQC for quality control

%GC (G & C bases added in the sequence)

Plots:

 X-axis: cycle number (1-150 for example)

 Y-axis: Phred score (0-40)  good quality: most of the bases in the sequence are closer to 40 (top most area)

 Less quality data: bad sample

Other QC measurement:

 Top right: GC %age  blue: ideal/normal distribution (general representation of human samples), red: result from
experiment (exact composition of nucleotides in the reads)

 Bottom left: amplicon assay, analyzing each nucleotide (Y axis: GC%, X axis: …)  significant difference in percentage:
overrepresentation of certain sequence

 Bottom right: …

More likely to get the accurate data from smaller molecule, that’s why fragmentation is required

Data processing

1. Remove adapter sequence (not informative for the experiment) & primers
2. Trim low quality reads from the ends  low Phred score, …? (listen to recording)

Chopping off the adapter/low quality reads would somehow affect result, albeit not significantly

Mapping reads to the reference

, Week 2: Tumor Biology and Clinical Behaviour

Aim: find where their sequence occurs in the genome (map against reference genome sequence)  Burrows Wheeler
transform as data compression algorithm, allows for searching large genome & incorporation of many queries/reads in short
time

SAM file: sequence alignment map  contains info about how sequence reads map to a reference genome (used in all NGS
tools)

Format


CIGAR line (bottom box)  9M = 9 matches to the reference, NM: non-matching (wrong base when mapped against the
reference)

I = inserted, D = deleted, N = …

BAM: binary SAM/compressed SAM

CRAM: doesn’t store sequenced data  relies on reference

Grey bar: reads completing sequencing process  allow analysis of reads that don’t agree with the reference sequence (actual
error vs. artefact; events located in the actual read)

a. wrong base: A > T
b. polymorphisms
c. deletion: sequenced read don’t have certain genomes present in reference sequence
d. insertion: extra piece of nucleotide normally absent in reference sequence)

Events located not in the actual read  detect with PET …?

 Distance between 2 tags/ends should be fixed  longer/shorter distance: insertion/deletion

, Week 2: Tumor Biology and Clinical Behaviour

LECTURE 12: BIOINFORMATICS ANALYSIS & WORKFLOW (S.Abeln) Monday, 05/11/2018


Tumor sample  sequencing & data
processing 1 (finding
events/mutations/etc)  data processing
2 (which specific mutation is acting as
driving/passenger mutation)

Most of the mutations: passenger
mutations  driver mutation is more
fundamental for tumor biology studies,
thus it has to be determined; driver v.
passenger mutations need to be
distinguished by comparing to reference
sequence (external data source: other
cohort, genome reference, etc)

TUMORS: hyper-mutate!


a. NGS
Massive parallel sequencing  huge amount of reads, more cost effective;
disadvantage: fragmented sequence, difficult to determine the order
Computational solution:
1. Read mapping (against reference genome)
Input: sequenced fragments, reference genome sequence
Reference genome: based on multiple individuals, to allow variations being
examined/taken into account
Process: string matching of sequence  reference & sequenced organism need
to be closely related (same species)
Output: reference alignment/BAM  fluctuations in the alignment: variation
of individual’s sequence being read
Mismatches in alignment caused by: polymorphism (SNP – patient specific),
artefact/read mistake (1% frequency – high, more nucleotide involved =
higher chance of read mistake), actual mutation (tumor-specific)
Depth of coverage:
Depth = average number of reads per base (over the whole sequencing
sample)
Coverage = number of reads per base (specific region in sequence)
2. De novo assembly (advantage: need no reference sequence)
Input: millions of sequenced fragments
Process: cut reads in k-mers  string matching (to determine read overlap)
Output: alignment & sequence of a new strain
b. Single molecule sequencing

Voordelen van het kopen van samenvattingen bij Stuvia op een rij:

Verzekerd van kwaliteit door reviews

Verzekerd van kwaliteit door reviews

Stuvia-klanten hebben meer dan 700.000 samenvattingen beoordeeld. Zo weet je zeker dat je de beste documenten koopt!

Snel en makkelijk kopen

Snel en makkelijk kopen

Je betaalt supersnel en eenmalig met iDeal, creditcard of Stuvia-tegoed voor de samenvatting. Zonder lidmaatschap.

Focus op de essentie

Focus op de essentie

Samenvattingen worden geschreven voor en door anderen. Daarom zijn de samenvattingen altijd betrouwbaar en actueel. Zo kom je snel tot de kern!

Veelgestelde vragen

Wat krijg ik als ik dit document koop?

Je krijgt een PDF, die direct beschikbaar is na je aankoop. Het gekochte document is altijd, overal en oneindig toegankelijk via je profiel.

Tevredenheidsgarantie: hoe werkt dat?

Onze tevredenheidsgarantie zorgt ervoor dat je altijd een studiedocument vindt dat goed bij je past. Je vult een formulier in en onze klantenservice regelt de rest.

Van wie koop ik deze samenvatting?

Stuvia is een marktplaats, je koop dit document dus niet van ons, maar van verkoper oddsters. Stuvia faciliteert de betaling aan de verkoper.

Zit ik meteen vast aan een abonnement?

Nee, je koopt alleen deze samenvatting voor €3,99. Je zit daarna nergens aan vast.

Is Stuvia te vertrouwen?

4,6 sterren op Google & Trustpilot (+1000 reviews)

Afgelopen 30 dagen zijn er 73918 samenvattingen verkocht

Opgericht in 2010, al 14 jaar dé plek om samenvattingen te kopen

Start met verkopen
€3,99
  • (0)
  Kopen