100% tevredenheidsgarantie Direct beschikbaar na je betaling Lees online óf als PDF Geen vaste maandelijkse kosten
logo-home
Summary online lectures Statistics and Methodology including examples €4,49
In winkelwagen

College aantekeningen

Summary online lectures Statistics and Methodology including examples

 1 keer verkocht

A summary of the online lectures made available for the course Statistics and methodology of the master Data Science & Society at Tilburg University. Different terms are explained as simple as possible to make it easy to understand. Also, several examples have been given about how to interpret spec...

[Meer zien]
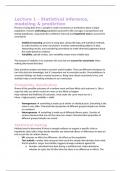
Voorbeeld 3 van de 28  pagina's

  • 18 oktober 2024
  • 28
  • 2024/2025
  • College aantekeningen
  • Dr. l.v.d.e. vogelsmeier
  • Alle colleges
Alle documenten voor dit vak (5)
avatar-seller
sterrevandergoes
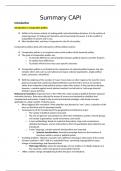
Lecture 1 – Statistical inference,
modeling & prediction
Process of using data from a sample to make conclusions or predictions about a larger
population. Involves estimating population parameters (like averages or proportions) and
testing hypotheses, using tools like confidence intervals and hypothesis tests to account for
uncertainty

- Statistical reasoning: process of using data, along with logic and statistical methods,
to make decisions or draw conclusions. Involves understanding patterns in data,
interpreting results, and considering uncertainty to make informed judgments about
the world based on evidence
- Variability: spread of data. Low variability means more reliable data

The purpose of statistics is to systemize the way that we account for uncertainty when
making data-based decisions

Data scientists analyze raw data to uncover useful insights. They use different techniques to
turn this data into knowledge, but it’s important not to overstate results. Overconfidence in
uncertain findings can lead to wasted resources. Being clear about uncertainty is key, and
statistics help us avoid making mistakes in our conclusions

Probability distribution
Shows all the possible outcomes of a random event and how likely each outcome is. Like a
map that tells you which results are more or less likely to happen
Help estimate the likelihood of outcomes. Area under the curve must sum to 1
Mean = highest point, variability = width

- Homogeneous  something is made up of similar or identical parts. Everything is the
same or very alike. Characteristics/properties of different groups/samples are similar
or consistent.
- Heterogeneous  something is made up of different/diverse parts. Consists of
various elements that are not the same/are mixed. Characteristics/properties of
different groups/samples are varied

Statistical testing
Method used to determine if there is enough evidence to support a specific claim or
hypothesis about data. Helps decide whether any observed effects or differences in data are
real or just due to random chance.
- H0: assumes no effect/no difference. No effect on the population
- Test statistic: number that measures how much the sample data deviates from what
the H0 predicts. Larger test statistic suggests stronger evidence against H0
o Number calculated from data during a statistical test. Helps determine
whether to reject the H0 (the idea that there is no difference or effect). The

, value of the test statistic shows how far the sample result is from what we
would expect under the H0
o Low: results are similar to what we expect if H0 is true. Don’t reject H0,
suggesting there’s no strong evidence for a significant effect/difference
o High: results are very different from what we expect if the H0 is true. Means
we reject H0, indicating strong evidence for significant effect/difference
- P-value: show how likely the observed results are if the H0 is true. P-value < 0.05,
results are unlikely under H0, and we reject H0

Larger test statistic usually better. If test statistic is much larger/smaller than most of the
values in the sampling distribution, it suggests something significant is happening

Sampling distribution
Pattern you get when you take many samples from a population and calculate a statistic (like
the average) for each sample. Shows how that statistic tends to vary from sample to sample.
Probability distribution of a statistic.

Help evaluate how unusual an observed test statistic is by comparing it to what is expected
under the H0

P-values
How likely it is to get our test results by chance. Small p-value means result is unlikely to be
due to chance, suggesting it’s significant

With one-tailed test, divide P-value by 2

P-value = 0.032, t-statistic = 1.86
A p-value of 0.032 means that if the H0 is true, there’s a 3.2% chance of getting a test
statistic as large as 1.86 or larger. It doesn’t tell us the probability of the hypothesis being
true or false, or if the result will happen again in future studies. It just measures how
surprising our result is, assuming the H0 is true.
All we can say is that there is a 0.032 probability of observing a test statistic at least as large
as the estimated test statistic, if the H0 is true

Statistical modeling
Statistical testing, as a stand-alone tool, is only useful in experimental contexts. Data
scientists need statistical modeling, as they work with observational data.

Modeling is powerful for analyzing complex, real-world data where strict experimental
control isn’t possible.

With statistical modeling, you are learning the important features of a distribution, and we
describe that in terms of variables, put them in an equation, and use them to understand the
world

, Prediction vs inference
- Inference: focuses on understanding relationships between variables. Example: do
more liquor stores lead to more crime?
- Prediction: aims to forecast future outcomes. Example: will it rain tomorrow based
on current weather data? For data science.

Design
In data science, we must always define the problem, collect data, process data, and clean
data

3 design steps
1. Operationalize research question: clearly define your research question in a way that
can be measured with statistics
2. Designing the analysis: pick the right model, test, or algorithm to answer your
question
3. Selecting data source: know what kind of data you need to analyze

Data scientists don’t conduct experiments, they analyze existing data.
Collecting own data is not always preferred over secondary data

EDA
Way to interactively analyze/explore data. Understand its patterns, trends, and relationships
before doing deeper analysis or building models. Exploring the data to see what’s
interesting/important.

Summary
- Statistical inference: using sample data to make predictions of conclusions about a
larger population, with tools like CI and hypothesis tests
- Statistical reasoning: making decisions based on data, patterns, and uncertainty to
draw conclusions
- Variability: how spread out the data is. Low variability means more reliable data
- Purpose of statistics: to handle uncertainty and avoid confidence in conclusion from
data
- Data analysis: data scientists turn raw data into insights but must be cautious not to
overstate results
- Probability distributions: show possible outcomes and how likely they are
- Homogeneous: all parts are similar
- Heterogeneous: parts are diverse/mixed
- Statistical testing: method to see if observed effects are real or due to chance, using
test statistic
- Test statistic: measures how far the sample data is from what’s expected under H0
- P-value: shows likelihood of getting the observed results if H0 is true. Small p-value
suggest significant results
- Sampling distribution: the pattern of a statistic across many samples
- Statistical modeling: helps analyze complex real-world data, focusing on important
relationships between variables. Used when experiment’s aren’t possible

Dit zijn jouw voordelen als je samenvattingen koopt bij Stuvia:

Bewezen kwaliteit door reviews

Bewezen kwaliteit door reviews

Studenten hebben al meer dan 850.000 samenvattingen beoordeeld. Zo weet jij zeker dat je de beste keuze maakt!

In een paar klikken geregeld

In een paar klikken geregeld

Geen gedoe — betaal gewoon eenmalig met iDeal, creditcard of je Stuvia-tegoed en je bent klaar. Geen abonnement nodig.

Direct to-the-point

Direct to-the-point

Studenten maken samenvattingen voor studenten. Dat betekent: actuele inhoud waar jij écht wat aan hebt. Geen overbodige details!

Veelgestelde vragen

Wat krijg ik als ik dit document koop?

Je krijgt een PDF, die direct beschikbaar is na je aankoop. Het gekochte document is altijd, overal en oneindig toegankelijk via je profiel.

Tevredenheidsgarantie: hoe werkt dat?

Onze tevredenheidsgarantie zorgt ervoor dat je altijd een studiedocument vindt dat goed bij je past. Je vult een formulier in en onze klantenservice regelt de rest.

Van wie koop ik deze samenvatting?

Stuvia is een marktplaats, je koop dit document dus niet van ons, maar van verkoper sterrevandergoes. Stuvia faciliteert de betaling aan de verkoper.

Zit ik meteen vast aan een abonnement?

Nee, je koopt alleen deze samenvatting voor €4,49. Je zit daarna nergens aan vast.

Is Stuvia te vertrouwen?

4,6 sterren op Google & Trustpilot (+1000 reviews)

Afgelopen 30 dagen zijn er 69988 samenvattingen verkocht

Opgericht in 2010, al 15 jaar dé plek om samenvattingen te kopen

Begin nu gratis
€4,49  1x  verkocht
  • (0)
In winkelwagen
Toegevoegd