100% tevredenheidsgarantie Direct beschikbaar na je betaling Lees online óf als PDF Geen vaste maandelijkse kosten
logo-home
Summary - Statistics (LCX046B05) €5,99
In winkelwagen

Samenvatting

Summary - Statistics (LCX046B05)

 1 keer verkocht

Summary of Statistics course LCX046B05

Voorbeeld 2 van de 13  pagina's

  • 24 oktober 2024
  • 13
  • 2023/2024
  • Samenvatting
Alle documenten voor dit vak (7)
avatar-seller
veroniquegold
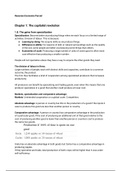
Lecture & lab 1:
Conditional indexing:
Tmp <- dat[dat$gender == “M”, ]
Tmp <- dat[dat$gender == “M”& dat$study == “IS”, ]  combining conditions.
Tmp <- dat[dat$gender != “M” | dat$english_grade > 7, ]  not equal to.

Adding new columns:
Dat$diff <- dat$english_grade – dat$english_score.

Head()  the first 6 lines of the data.
Str()  the structure of the data.

Barplot:  visualizes nominal data.
Table()
Barplot(table())

Hist()  shows frequency of all values in groups. Looks for a general pattern, symmetry, outliers.

Col = c  kleuren voor de barplot.
Ylim = c  limiet voor de y-as.
Main  naam voor de barplot.
Xlab  naam voor de x-as.
Ylab  naam voor de y-as.

Descriptive statistics:
Mean()  mean for the variable.
Min()  minimum value.
Max()  maximum value.
Range()  gives both min and max.
Diff()  gives difference between max and min.
Var()  variance: average squared deviation form mean.
Sd()  standard deviation (square root of variance).
Table(dat$gender)  frequency table.
Table(dat$gender, dat$study)  cross table.

Lecture & lab 2:
Descriptive statistics:
- Describes data.
- Measures of central tendency  mean, median, mode.
- Measures of variation  range, IQR, variance, standard deviation.
o Information on distribution of the data.

Inferential statistics:
- Describes data of sample to infer patterns in population  statistical tests.
- Generalize outcomes of a sample to a population.
o Compares 2 groups (or a single group with fixed value).
o Associations between 2 variables.

Categorical variables:
- Nominal  just categorization, no ordering (gender).
- Ordinal  categories have order, but do know distance (bad - neutral – good).

Numerical variables:
- Interval  numbered categories have a known distance between them (degrees Celsius).

, - Ratio  numbered categories with a meaningful 0 (age).
Density curve:
- Visualizes a distribution.
o Plot(density(), main =, xlab = )

Central tendency:
Mode  most frequent (all measurement levels).
Median  middle value of sorted data (ordinal, interval, ratio).
Mean  sum of observations divided by number of observations (interval & ratio).

Measure of variation:
Quartiles  4 subsets of equal size. Quantile().
- Q1  cutpoint between group 1 and 2 (first 25%).
- Q2  cutpoint between group 2 and 3 (first 50%).
- Q3  cutpoint between group 3 and 4 (first 75%).

Percentiles  hundred equal-sized subsets.
- Q1 = 25th percentile.
- Q2 = 50th percentile.

Interquartile range IQR() = Q3-Q1.

Visualization of variation  boxplot (visualizes numerical data).


Important measures of variation:
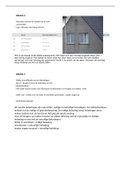
Population variance


Sample variance


Standard deviation


Standard deviation  relating an individual to a population.

Standard error  relating a sample to a population.

Dit zijn jouw voordelen als je samenvattingen koopt bij Stuvia:

Bewezen kwaliteit door reviews

Bewezen kwaliteit door reviews

Studenten hebben al meer dan 850.000 samenvattingen beoordeeld. Zo weet jij zeker dat je de beste keuze maakt!

In een paar klikken geregeld

In een paar klikken geregeld

Geen gedoe — betaal gewoon eenmalig met iDeal, creditcard of je Stuvia-tegoed en je bent klaar. Geen abonnement nodig.

Direct to-the-point

Direct to-the-point

Studenten maken samenvattingen voor studenten. Dat betekent: actuele inhoud waar jij écht wat aan hebt. Geen overbodige details!

Veelgestelde vragen

Wat krijg ik als ik dit document koop?

Je krijgt een PDF, die direct beschikbaar is na je aankoop. Het gekochte document is altijd, overal en oneindig toegankelijk via je profiel.

Tevredenheidsgarantie: hoe werkt dat?

Onze tevredenheidsgarantie zorgt ervoor dat je altijd een studiedocument vindt dat goed bij je past. Je vult een formulier in en onze klantenservice regelt de rest.

Van wie koop ik deze samenvatting?

Stuvia is een marktplaats, je koop dit document dus niet van ons, maar van verkoper veroniquegold. Stuvia faciliteert de betaling aan de verkoper.

Zit ik meteen vast aan een abonnement?

Nee, je koopt alleen deze samenvatting voor €5,99. Je zit daarna nergens aan vast.

Is Stuvia te vertrouwen?

4,6 sterren op Google & Trustpilot (+1000 reviews)

Afgelopen 30 dagen zijn er 68175 samenvattingen verkocht

Opgericht in 2010, al 15 jaar dé plek om samenvattingen te kopen

Begin nu gratis
€5,99  1x  verkocht
  • (0)
In winkelwagen
Toegevoegd