100% tevredenheidsgarantie Direct beschikbaar na betaling Zowel online als in PDF Je zit nergens aan vast
logo-home
Summary Exam notes for Methods of Communication Research and Statistics (MCRS) second exam €14,46
In winkelwagen

Samenvatting

Summary Exam notes for Methods of Communication Research and Statistics (MCRS) second exam

 0 keer verkocht

Providing all relevant and comprehensive content for Methods of Communication Research and Statistics second exam (week 8-week 12). Content covers the book, lectures, and all other relevant material.

Voorbeeld 3 van de 21  pagina's

  • 4 november 2024
  • 21
  • 2022/2023
  • Samenvatting
Alle documenten voor dit vak (11)
avatar-seller
kaivainomaa
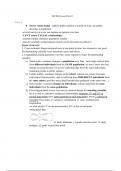
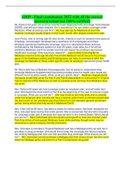
MCRS Exam Part 2

Week 8
● Survey study design - capture public opinion at a point in time; accurately
describes a population
-several surveys in a row can capture an opinion over time
-CAN’T assess CAUSAL relationships!
-external validity increases population validity
-must be carefully worded and pre-tested; can be fast and cost-effective
Types of surveys:
1. Cross-sectional- things measured once at one point in time, less expensive, not good
for determining causality (can't determine cause and effect)
2. Longitudinal-asking questions over time, more expensive, better for determining
causality
a) Trend study- examines changes in population over time, each study collects data
from different individuals from the SAME population; we don’t know why has
change occurred because we are not collecting data from the same individuals;
examining trends in public opinion
b) Cohort studies- examines changes in the cohort; cohorts are groups of people
with shared characteristics; data is collected from DIFFERENT individuals from
the same cohort; provides more detail (people that graduated at the same time…)
c) Panel studies- examines changes in individuals; collects data from the same
individuals from the same population,
d) Cross-lagged panel survey- best survey research design for assessing causality,
but it is only an indicator; reciprocal relationships; measures I.V and D.V at
several time points (uses same questions at each time point); meets 2 criteria for
causality (time order, co-variance) combination of cross-sectional and
longitudinal
-to what extent I.V at one point predicts D.V at the second point
-using panel data


x1 study technique ,y1 grade one time point x2 study
tecnique ,y2 grade second time point

, Population- contains every one of the units the researcher has elected to study; every
person in a group we are studying; Element- single entity of a population
Sample- a selected segment of a population presumed to represent that population
Census- study of entire population
Parameters- describe a population; Statistics- describe a sample
Sampling frame- list from which a sample is drawn
Stratum- a subset of elements from a population that share a characteristic
Selection threat- concerns the generalizations of findings to other reasons
-with appropriate sampling, we can generalize with statistical confidence, from a sample
to a wider population
-to determine causality we need true experiment

Sampling methods:
1. Probability Sampling:
a) (Simple) Random sample- everyone has an equal chance of being selected; the
computer generates from an entire population
b) Cluster sampling- random sampling from a larger population
c) Systematic sampling- random number generator (e.g. every 6th person)
d) Stratified random sampling- performing random sample from specific groups
(strata- groups sharing characteristics)
2. Non-probability sampling:
a) Convenience sampling- studying elements that are easily accessible
b) Purposive sampling- participants are chosen based on judgments of a researcher
c) Snowball sampling (type of convenience sampling)-when recruiting small group
of participants that provide us with contacts of possible new participants (people
share characteristics)
d) Quota sampling- elements for research are distinguished due to characteristics;
participants for each category are recruited using convenience sampling; purpose
to reach a quota (needed number)

, Social desirability bias
-indirect questioning (third party “what would your friend answer”)
-when you are afraid that your answers do not align with the norm
- solution: showing its okay to answer in a way that is not socially desirable
Item non-response bias: respondents don’t understand questions, don’t want to answer
questions; consequences-low external validity(reason not to answer questions due to
personal characteristics); solution: pre-test question, change question, change answer
format
Pre-testing in survey design: wording, aesthetic, logical wording, time to complete the
survey; after respondents fill in questions, ask for evaluation; cognitive answering (out
loud); feedback

Types of Validity: Did we measure what was intended in the first place (systematic and
random error)
1. External validity: the extent to which the results of the study can be generalized to a
context other than the study itself (is the causal relationship applicable to other
situations); to what extent is your research telling you something about the population
you are interested in
a) Population validity- results can be generalized to the population, and
characteristics of the groups shouldn’t be similar (if they are, it affects external
validity)
b) Ecological validity- the extent to which the results can be generalized to
real-world conditions and circumstances;
2. Internal validity: the certainty with which you can test casual relationships in the
research (only experiments test causality; random selection and assignment); is the effect we
found caused by our independent variable or something else

What affects external validity:
-is low when there are similar characteristics in groups
-is low when item non-response bias
-lower in (true) experimental design
-low ecological validity in lab setting
-population validity is low when we choose a specific group of people
Threaths:
a) History threat: observed effect doesnt generalize to other time periods
b) Setting threat: observed effect only holds in a specific setting
-association with artificiality: Pretesting threat: observed effect is found only when a
pretest is performed; Reactivity: when participants or researcher react to the fact that they
are participating in a research study

Voordelen van het kopen van samenvattingen bij Stuvia op een rij:

Verzekerd van kwaliteit door reviews

Verzekerd van kwaliteit door reviews

Stuvia-klanten hebben meer dan 700.000 samenvattingen beoordeeld. Zo weet je zeker dat je de beste documenten koopt!

Snel en makkelijk kopen

Snel en makkelijk kopen

Je betaalt supersnel en eenmalig met iDeal, creditcard of Stuvia-tegoed voor de samenvatting. Zonder lidmaatschap.

Focus op de essentie

Focus op de essentie

Samenvattingen worden geschreven voor en door anderen. Daarom zijn de samenvattingen altijd betrouwbaar en actueel. Zo kom je snel tot de kern!

Veelgestelde vragen

Wat krijg ik als ik dit document koop?

Je krijgt een PDF, die direct beschikbaar is na je aankoop. Het gekochte document is altijd, overal en oneindig toegankelijk via je profiel.

Tevredenheidsgarantie: hoe werkt dat?

Onze tevredenheidsgarantie zorgt ervoor dat je altijd een studiedocument vindt dat goed bij je past. Je vult een formulier in en onze klantenservice regelt de rest.

Van wie koop ik deze samenvatting?

Stuvia is een marktplaats, je koop dit document dus niet van ons, maar van verkoper kaivainomaa. Stuvia faciliteert de betaling aan de verkoper.

Zit ik meteen vast aan een abonnement?

Nee, je koopt alleen deze samenvatting voor €14,46. Je zit daarna nergens aan vast.

Is Stuvia te vertrouwen?

4,6 sterren op Google & Trustpilot (+1000 reviews)

Afgelopen 30 dagen zijn er 62774 samenvattingen verkocht

Opgericht in 2010, al 15 jaar dé plek om samenvattingen te kopen

Start met verkopen
€14,46
  • (0)
In winkelwagen
Toegevoegd