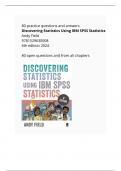
Discovering Statistics Using IBM SPSS Statistics / 80 test questions and answers entire book / Andy Field / 6th edition 2024
7 keer bekeken 0 keer verkocht
Vak
University
Instelling
University
Boek
Discovering Statistics Using IBM SPSS Statistics
These are 80 test questions and answers from the entire book Discovering Statistics Using IBM SPSS Statistics by Field the 6th edition 2024. The questions go from general to more complex. Used by our study group in preparation for the exam.
summary discovering statistics using ibm spss stat
test questions discovering statistics using ibm sp
exam questions discovering statistics using ibm s
Gekoppeld boek
Titel boek:
Auteur(s):
Uitgave:
ISBN:
Druk:
Meer samenvattingen voor studieboek
ik heb hem met 8 behaald
Alles voor dit studieboek
(2)
Geschreven voor
University
University
Alle documenten voor dit vak (29)
Verkoper
Volgen
Scriptiebibliotheek
Ontvangen beoordelingen
Voorbeeld van de inhoud
, 80 test questions and answers based on the book *Discovering Statistics
Using IBM SPSS Statistics* (6th edition) by Andy Field.
We’ve made these questions as a study group in preparation for the final
exams.
1. What is the primary goal of descriptive statistics?
- Answer: Descriptive statistics summarize and describe the features of
a dataset in a meaningful way, such as through measures of central
tendency, dispersion, and graphical representations.
2. What is a frequency distribution?
- Answer: A frequency distribution is a summary of how often each
different value occurs in a dataset.
3. What is the purpose of a histogram?
- Answer: A histogram is a graphical representation of the distribution of
a dataset. It shows the frequency of data points within certain ranges
(bins).
4. What does the term “central tendency” refer to?
- Answer: Central tendency refers to the central point or typical value in
a dataset, commonly measured using the mean, median, or mode.
5. What is the difference between the mean, median, and mode?
- Answer: The mean is the average of all data points, the median is the
middle value when data is ordered, and the mode is the value that occurs
most frequently.
6. How do you calculate the standard deviation?
- Answer: The standard deviation is calculated as the square root of the
variance, which measures the average squared deviation from the mean.
7. What is a z-score?
Voordelen van het kopen van samenvattingen bij Stuvia op een rij:
Verzekerd van kwaliteit door reviews
Stuvia-klanten hebben meer dan 700.000 samenvattingen beoordeeld. Zo weet je zeker dat je de beste documenten koopt!
Snel en makkelijk kopen
Je betaalt supersnel en eenmalig met iDeal, creditcard of Stuvia-tegoed voor de samenvatting. Zonder lidmaatschap.
Focus op de essentie
Samenvattingen worden geschreven voor en door anderen. Daarom zijn de samenvattingen altijd betrouwbaar en actueel. Zo kom je snel tot de kern!
Veelgestelde vragen
Wat krijg ik als ik dit document koop?
Je krijgt een PDF, die direct beschikbaar is na je aankoop. Het gekochte document is altijd, overal en oneindig toegankelijk via je profiel.
Tevredenheidsgarantie: hoe werkt dat?
Onze tevredenheidsgarantie zorgt ervoor dat je altijd een studiedocument vindt dat goed bij je past. Je vult een formulier in en onze klantenservice regelt de rest.
Van wie koop ik deze samenvatting?
Stuvia is een marktplaats, je koop dit document dus niet van ons, maar van verkoper Scriptiebibliotheek. Stuvia faciliteert de betaling aan de verkoper.
Zit ik meteen vast aan een abonnement?
Nee, je koopt alleen deze samenvatting voor €7,16. Je zit daarna nergens aan vast.