Data Science
DEP Summary
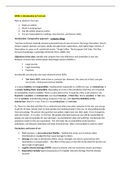
We have data from a lot of sources (files) and we want to do something
with this data (senses, visualizationa) the sources are almost never in
the shape we need, we put it in a shape of a ‘cube’
- (Data)sources cubes (DBMS) senses (visualisation, analytical
applications)
- We have to transform or re-shape the data to store it in the DBMS
and then to use it for e.g. analyzation
DEP mostly about the preparing phase of using the data science process
(often takes 80% of the time)
DM mostly about the analysis phase of using the data science process
We use a cube:
- The cube is a generic shape for data, it fits analytical purposes
- A dataset often contains many related cubes
each cube focuses on one or more facts
they are related through dimensions
- Data is an asset: it should not live in files transferred by email or
download (you get many different versions), it should live in a ‘safe
place’: a DBMS (database management system), so you can connect
to it
Method (of using the cube)
1. Design the cube
Determine the questions the data should answer
Envision tabular reports that can answer the questions
Determine for each question and report: the fact, dimensions and
granularity
Combine into one star schema
Formulate what one row in fact table means
2. Design associated table structure (UML)
, 3. Create empty tables in database (SQL)
4. Prepare data and fill tables (SQL)
Data exploration what is in the source data? How is it represented?
Databases:
- A database is a possibly large collection of data, that has to be
shared/exchanged, searched, corrected etc., and it should under no
circumstances get lost or corrupted in any way
- A DBMS (database management system) is software that manages
databases, allows these actions, and makes sure that your data is
safe
Availability, reliability, performance, scalability, security
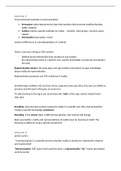
Data is often structured in tables:
- Rows are ‘records’, columns are ‘attributes’
- Attributes = the properties or characteristics of the data stored in a
dataset, often referred to as columns in a table. Each attribute
represents a specific aspect of the entity being described, and it
holds a value for each record (or row) in the dataset.
- The ‘instance data’ is the ‘real’ data (green), the ‘schema’ is the
description of the table structure (blue)
The concept ‘key’ = a collection of one or more attributes that uniquely
determine a record in a table
- primary key = one most important key
- foreign key = attribute(s) in a table that form a reference to one or
more record in another relation (can connect to tables) what we
use a key for: from one table you can refer to a record in another
table by means of this key
- surrogate key = artificially added code or number to function as a
key
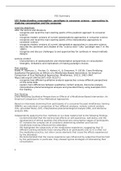
Example In the tables above
- First table: ‘Number’ is the primary key, ‘From’ and ‘To’ are the
foreign key (connects the first table to two other tables)
- Second table: 'Code’ is the primary key
Database server
- This is the computer system running the DBMS software
, - It runs the background serving (SQL) requests and keeping your data
safe
Database client = a tool accessing the database server (e.g. R, Tableau)
- We use PhpPgAdmin for database administration
- We use R for data cleaning/transforming
- We use Tableau for data visualization (not with R)
These are all database clients connecting to the server
SQL = the standard language used for managing and manipulating
relational databases. SQL requests allow data scientists to retrieve, insert,
update, and delete data from databases.
Shapes of data
- Data is often structured in tables the structure of the tables and
contents often have to be reshaped to be able to use them
- There is more to shape than the structure of the data, the contents
can also be in the wrong shape (different currencies, missing values
etc.) problems with data quality are often more time consuming
than re-shaping the structure
Data exploration: initial phase of data analysis where the dataset is
examined to gain insight into structure, patterns, quality, shape etc.
- To find quality problems actively search for them, using tools like:
Summery statistics & Data visualization, test assumptions (e.g.
uniqueness)
Common Summary statistics & visualization
- Per attribute
basic: range, mean, median etc.
advanced: distribution (histogram), Skewness/Kurtosis
(asymmetry & peakiness), percentiles, outliers, Cross-tabulation,
temporal/spatial patterns
- Between attributes
Correlation & covariance
Assumptions: inclusion (keys which connect tables), multi-
attribute uniqueness, semantic dependencies (relationship
between words(
Attribute types & formats
- Not every analysis method can be applied to any data, some have
limitations depending on attribute types:
Continues real numbers, time, coordinates
Discrete integer, nominal (limited set of categories, like
Male/Female), ordinal (same as nominal but with an order, like
Low/Medium/High)
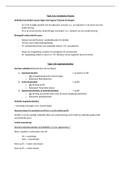
Attributes always have a type, types which are often occurring:
DEP Summary
We have data from a lot of sources (files) and we want to do something
with this data (senses, visualizationa) the sources are almost never in
the shape we need, we put it in a shape of a ‘cube’
- (Data)sources cubes (DBMS) senses (visualisation, analytical
applications)
- We have to transform or re-shape the data to store it in the DBMS
and then to use it for e.g. analyzation
DEP mostly about the preparing phase of using the data science process
(often takes 80% of the time)
DM mostly about the analysis phase of using the data science process
We use a cube:
- The cube is a generic shape for data, it fits analytical purposes
- A dataset often contains many related cubes
each cube focuses on one or more facts
they are related through dimensions
- Data is an asset: it should not live in files transferred by email or
download (you get many different versions), it should live in a ‘safe
place’: a DBMS (database management system), so you can connect
to it
Method (of using the cube)
1. Design the cube
Determine the questions the data should answer
Envision tabular reports that can answer the questions
Determine for each question and report: the fact, dimensions and
granularity
Combine into one star schema
Formulate what one row in fact table means
2. Design associated table structure (UML)
, 3. Create empty tables in database (SQL)
4. Prepare data and fill tables (SQL)
Data exploration what is in the source data? How is it represented?
Databases:
- A database is a possibly large collection of data, that has to be
shared/exchanged, searched, corrected etc., and it should under no
circumstances get lost or corrupted in any way
- A DBMS (database management system) is software that manages
databases, allows these actions, and makes sure that your data is
safe
Availability, reliability, performance, scalability, security
Data is often structured in tables:
- Rows are ‘records’, columns are ‘attributes’
- Attributes = the properties or characteristics of the data stored in a
dataset, often referred to as columns in a table. Each attribute
represents a specific aspect of the entity being described, and it
holds a value for each record (or row) in the dataset.
- The ‘instance data’ is the ‘real’ data (green), the ‘schema’ is the
description of the table structure (blue)
The concept ‘key’ = a collection of one or more attributes that uniquely
determine a record in a table
- primary key = one most important key
- foreign key = attribute(s) in a table that form a reference to one or
more record in another relation (can connect to tables) what we
use a key for: from one table you can refer to a record in another
table by means of this key
- surrogate key = artificially added code or number to function as a
key
Example In the tables above
- First table: ‘Number’ is the primary key, ‘From’ and ‘To’ are the
foreign key (connects the first table to two other tables)
- Second table: 'Code’ is the primary key
Database server
- This is the computer system running the DBMS software
, - It runs the background serving (SQL) requests and keeping your data
safe
Database client = a tool accessing the database server (e.g. R, Tableau)
- We use PhpPgAdmin for database administration
- We use R for data cleaning/transforming
- We use Tableau for data visualization (not with R)
These are all database clients connecting to the server
SQL = the standard language used for managing and manipulating
relational databases. SQL requests allow data scientists to retrieve, insert,
update, and delete data from databases.
Shapes of data
- Data is often structured in tables the structure of the tables and
contents often have to be reshaped to be able to use them
- There is more to shape than the structure of the data, the contents
can also be in the wrong shape (different currencies, missing values
etc.) problems with data quality are often more time consuming
than re-shaping the structure
Data exploration: initial phase of data analysis where the dataset is
examined to gain insight into structure, patterns, quality, shape etc.
- To find quality problems actively search for them, using tools like:
Summery statistics & Data visualization, test assumptions (e.g.
uniqueness)
Common Summary statistics & visualization
- Per attribute
basic: range, mean, median etc.
advanced: distribution (histogram), Skewness/Kurtosis
(asymmetry & peakiness), percentiles, outliers, Cross-tabulation,
temporal/spatial patterns
- Between attributes
Correlation & covariance
Assumptions: inclusion (keys which connect tables), multi-
attribute uniqueness, semantic dependencies (relationship
between words(
Attribute types & formats
- Not every analysis method can be applied to any data, some have
limitations depending on attribute types:
Continues real numbers, time, coordinates
Discrete integer, nominal (limited set of categories, like
Male/Female), ordinal (same as nominal but with an order, like
Low/Medium/High)
Attributes always have a type, types which are often occurring: