100% tevredenheidsgarantie Direct beschikbaar na betaling Zowel online als in PDF Je zit nergens aan vast
logo-home
ARMS general part - lectures and seminars €5,49   In winkelwagen

College aantekeningen

ARMS general part - lectures and seminars

1 beoordeling
 135 keer bekeken  5 keer verkocht

Dit is een samenvatting van de hoorcolleges gegeven voor het tentamen statistiek op 13 maart 2020. This is a summary of the lectures and seminars for the assessment on the 13th of march, for the course ARMS.

Voorbeeld 4 van de 35  pagina's

  • 5 maart 2020
  • 35
  • 2019/2020
  • College aantekeningen
  • Onbekend
  • Colleges 1 t/m 5 en seminar 1 en 2
Alle documenten voor dit vak (5)

1  beoordeling

review-writer-avatar

Door: lykevb • 4 jaar geleden

avatar-seller
willemijnvanes
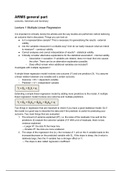
ARMS general part
Lectures, Seminars and Summary


Lecture 1 Multiple Linear Regression

It is important to critically review the articles and the way studies are performed, before believing
an outcome that is discussed. Things you can look at:
● Is it a representative sample? This is necessary for generalising the results - external
validity
● Are the variables measured in a reliable way? And do we really measure what we intend
to measure? - construct validity
● Correct analyses and correct interpretation of results? - statistical validity
● Critically consider alternative explanations for the statistical association! - internal validity
○ Association ≠ causation: if variables are related, does not mean that one causes
the other. There can be an alternative explanation possible.
○ Does effect remain when additional variables are included?
Investigate with multiple regression!

A simple linear regression model involves one outcome (Y) and one predictor (X). You assume
a linear relation between one variable and a certain outcome.
○ Outcome = DV = dependent variable
○ Predictor = IV = independent variable


Extending a simple linear regression model by adding more predictors to the model. A multiple
linear regression model involves one outcome and multiple predictors.


Two things in regression that are important to check if you have a good statistical model. So if
the model is a good way to describe the data and if the predictor is useful for predicting your
outcome. Two main things that are evaluated:
1. The amount of variance explained (​R​2​), i.e. the sizes of the residuals: how well do the
predictors (X) explain the outcome variable (Y)? With a lot of residuals, there is less
variance explained.
→ Larger ​R​2​: the dots fit the linear line.
→ Smaller ​R2​​ : the dots are more scattered.
2. The slope of the regression line (​b​1​): the increase of 1 unit on the X variable leads to the
increase/decrease on the predicted variable with B​1​. If the slope is steep, the ​b-​ value is
relatively large, then the X variable has a stronger effect on Y.
→ The slope is also called ​regression coefficient​.

,Multiple linear regression (MLR) examines a model where multiple predictors are included to
check their unique linear effect on Y.

The model

The full equation can be shortened by the observed score that is predicted by the model, but
always has some error (​residuals​) because the model will not predict perfectly.


So the observed outcome is a prediction based on the model and some error in the prediction.
The predicted part is called the statistical model (multiple linear regression) and is noted by Ŷ.


Every person has a different error (​ei​​ ) and as a result a different outcome (Y​i​). The ​i​ belongs to
the variables where people vary on, and the terms without it are the ​model parameters:​ relation
of the whole group!
→ Multiple linear regression model is also called an ​additive linear model​, because you are
adding multiple predictors (and the effect is additive - as you can see in the equation).

Types of variables

What type of variables can you include in a multiple regression? (model assumption)
There are formal distinctions in 4 measurement levels: nominal, ordinal, interval and ratio. But
the most important distinction is nominal/ordinal vs. interval/ratio.
● Nominal and ordinal creates categories (a.k.a. ​categorical​ or qualitative).
● Interval and ratio scores have numerical meaning (a.k.a. ​continuous,​ quantitative or
numerical).
The outcome of the multiple linear regression always requires a continuous outcome. The
predictors also need to be continuous.
→ Multiple linear regression is created for the situation where all the variables are continuous.
But categorical predictors can be included as ​dummy variables​. The dummy variable is a
variable with only two possible outcomes/values 0 or 1. You can write the equation of the
multiple linear regression with the intercept, the regression coefficient and the dummy predictor.
For example:


The coefficients have a clear interpretation, because they are multiplied by either 0 or 1. That
leaves the equation with either the intercept plus the regression coefficient (because it is
multiplied by 1) or only the intercept (because the regression coefficient is multiplied by 0).

,b0​​ can be interpreted, in this case, as the average grade of the females; ​b​0 ​+ ​b1​​ as the average
grade of the males. This means that ​b1​​ denotes the difference in the prediction for the average
grades for males and females. So ​b1​​ has another interpretation with dummy variables
(difference between groups, instead of the regression coefficient)!
Note! Don’t treat a dummy variable with more categories as a normal regression equation.
Instead, create multiple dummy variables. The multiple dummy variables are again noted with 0
or 1: if your first variable is zero, this variable disappears (​b1​​ *0); if your second variable is zero,
this variable disappears as well (​b​2​*0); if you score one on one of the variables, the rest
automatically becomes zero (because it cannot be that variable anymore)!
The last category doesn’t need a dummy variable, this is the ​reference group.​ Because if you
score zero everywhere, this means automatically that this is the last category (only ​b0​​ remains -
interpretation of the intercept is the average on Y for the reference group). For example:


→ The category yellow does not exist in the equation, but if you score 0 everywhere then there
is no red, no blue and no green = yellow (reference group).

MLR and hierarchical MLR

With a ​hierarchical multiple linear regression model​ you can test if your first predictors are good
predictors (research question 1), and if adding predictors improves the model significantly and
relevantly to explain the outcome Y (research question 2).
There are a lot of hypotheses you can test:
For each model (and research question 1):
● H​0​: ​R​2​ = 0 (the predictors of the model do not predict y)
● H​A​: ​R​2​ > 0
Research question 2:
● H​0​: ​R​2​-change = 0 (the additional predictors do not improve model)
2​
● H​A​: ​R​ -change > 0
For each predictor ​x​ within each model:
● H​0​: ​b​1​ = 0 (no unique effect of ​x​1​ within this model)
● H​A​: ​b​1​ ≠ 0

Output

→ Always read footnotes in the SPSS output!
R-​ values:
● R:​ multiple correlation coefficient; correlation between the observed Y and Y predicted

, ● R2​​ : proportion of variance of the outcome variable explained by the model; computed on
the sample and not a good estimate of the population (biased - the more predictors the
higher it is)
Inferential statistics means using the sample to say something more general, in that case use:
● Adjusted R​2​: proportion of explained variance corrected for the bias; to say something
about a population
● R2​​ ​Change​: improvement of fit compared to previous model
○ For the first model this is the same as the ​R​2​, because there is no previous model
to compare it to (only model zero).
○ For the second model it is the difference between the change in ​R2​​ with its
significance tested.
Regression coefficients:
● B:​ unstandardised coefficients; the relation/slope between the predictor and the outcome
within a model with ​x​ predictors (changes with more/less predictors!); includes the scale
of the variables that you are measuring.
→ ​Unique contribution​ of that predictor, given that the other predictors are part of the
model.
○ Controlling for other variables: the change of one variable in the predicted
outcome, if the other variable is fixed (the same for the whole group).
○ NOT bivariate correlation: how is X related to Y (ignores other variables).
● Beta​: standardized coefficients; which predictor has the strongest contribution to the
outcome, because the scale of the predictor is removed by standardization (they are
comparable).

Exploration or theory evaluation

When you do research, you have to think carefully about what variables to include. Otherwise
there could be effects that don’t make sense, because there are other variables in play. By
adding them to your multiple linear regression model, you control for these variables and see
unique effects.
Adding a lot of predictors into a multiple linear regression model, there are two ways of doing
this:
● Method enter​ (forced entry): based on a theory you include a few of all the predictors in
the MLR.
● Stepwise method:​ all predictors are explored for their contribution to predicting Y and the
final model will be based on observed relation in the data set.

Model assumptions

Statistical inference is based on many assumptions. Serious violations lead to incorrect results
such as wrong ​p-​ values or wrong confidence intervals. This is why you always have to check if
your data-set is fit to do a multiple linear regression analysis.
→ The model assumptions are discussed in the Grasple lessons.

Voordelen van het kopen van samenvattingen bij Stuvia op een rij:

Verzekerd van kwaliteit door reviews

Verzekerd van kwaliteit door reviews

Stuvia-klanten hebben meer dan 700.000 samenvattingen beoordeeld. Zo weet je zeker dat je de beste documenten koopt!

Snel en makkelijk kopen

Snel en makkelijk kopen

Je betaalt supersnel en eenmalig met iDeal, creditcard of Stuvia-tegoed voor de samenvatting. Zonder lidmaatschap.

Focus op de essentie

Focus op de essentie

Samenvattingen worden geschreven voor en door anderen. Daarom zijn de samenvattingen altijd betrouwbaar en actueel. Zo kom je snel tot de kern!

Veelgestelde vragen

Wat krijg ik als ik dit document koop?

Je krijgt een PDF, die direct beschikbaar is na je aankoop. Het gekochte document is altijd, overal en oneindig toegankelijk via je profiel.

Tevredenheidsgarantie: hoe werkt dat?

Onze tevredenheidsgarantie zorgt ervoor dat je altijd een studiedocument vindt dat goed bij je past. Je vult een formulier in en onze klantenservice regelt de rest.

Van wie koop ik deze samenvatting?

Stuvia is een marktplaats, je koop dit document dus niet van ons, maar van verkoper willemijnvanes. Stuvia faciliteert de betaling aan de verkoper.

Zit ik meteen vast aan een abonnement?

Nee, je koopt alleen deze samenvatting voor €5,49. Je zit daarna nergens aan vast.

Is Stuvia te vertrouwen?

4,6 sterren op Google & Trustpilot (+1000 reviews)

Afgelopen 30 dagen zijn er 83637 samenvattingen verkocht

Opgericht in 2010, al 14 jaar dé plek om samenvattingen te kopen

Start met verkopen
€5,49  5x  verkocht
  • (1)
  Kopen