This is the fourth and final assignment for Unit 5- Business Accounting. I achieved a DISTINCTION in this assignment and an overall grade of D*D*D* (highest grade possible) Please DO NOT copy, but please use it as a guide as it will help you pass. Good Luck with your course!
Jay Healy
Unit 5 Business Accounting
P5,M2 & D2
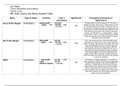
P5- Bob’s Sports Bar Ratio Analysis Table
Ratio Type of Ratio Formula Year 1 Significant? Evaluative Comments on
calculations Significance
Gross Profit Margin Profitability Gross profit 202,000 The gross profit currently stands at 57.71% which is
Sales X10 350,000 x100 fantastic for Bob’s sports bar. It means that for every
= 57.71%
Yes £1 that Bob makes he has made a 57p profit from it.
Of course this is before any costs are deducted so the
final amount of profit that Bob will be able to use on
the business will be lower. But as long as the gross
profit is over 50% Bob is in a strong positon. I would
recommend in order to increase the margin that Bob
either increase the prices of his products or reduce
the direct costs of the sales.
Net Profit Margin Profitability Net profit 68,780 This is the actual amount of profit that Bob makes
Sales X10 350,000 x100 from every £1 made. So for every £1 Bob makes he
= 19.65%
Yes makes 19p profit. Putting that on a larger scale, Bobs
sales was £350,000; so by the end of the year the
overall profit that Bob will have made is £68,780.
Bob should be extremely satisfied with this and as
long as Bob can keep growing his business this figure
will only get bigger. If for some reason Bob isn’t
happy with his new profit then I would recommend
that once again he increase the prices of his products
or lower his expenses.
ROCE Profitability Net profit 68,780 x100 The ‘Return on Capital Employed’ is very high for
x100 54,494 Bob’s business at 126.22% which is great it gives Bob
Owners capital = 126.22%
No a greater understanding of just how profitable his
business is. Comparing how much money has been
made and how much has been put into the business
Bob is in the profit zone as this ratio shows. This
means that Bob is able to repay back his investments
after each financial year which makes loans and
grant much more acquirable.
, Jay Healy
Unit 5 Business Accounting
P5,M2 & D2
Gearing Ratio Liquidity Loan capital 11,706 Bobs gearing ratio shows that for every £1 that his
Capital 54,494 x100 business has 21p of that is borrowed. This isn’t a
employed = 21%
No substantial amount and from looking at his profit
margins he is well capable of paying that back in no
time so I would think that Bob shouldn’t be that
concerned. Of course the one solution to not having
to worry about this ratio is to stop borrowing money.
Obviously Bob needed this as a starting point but now
that he has gained a substantial amount of money
from profits he may now not have to borrow any.
Current Ratio Liquidity Current assets 40,000 The current ratio for Bobs sports bar represents
Current 7,000 £5.71 of current assets to every £1 of current
liabilities = 5.71:1
No liabilities.
Meaning he has no liquidity problems however his
value of assets is much greater than his liabilities.
With a £4.70 differences this money is being wasted.
I would recommend that Bob put his money to good
use; he also has 3,000 sitting in the bank doing
nothing so I would put money into the business by
upgrading it or even starting a new branch
somewhere.
Acid Ratio Liquidity 40,000- 35,000 The acid test shows Bob’ sports bars ability to pay off
Current assets- 7,000 its liabilities. This ratio shows that for every £1 of
stock
= 0.71:1
Yes liability that Bob has he has 71p worth of assets. This
Current is extremely bad for Bob as this means that he
liabilities doesn’t have enough current assets to pay off short
term liabilities because his stock is so much; until he
sells his stock he won’t have a positive acid ratio.
This puts him at great danger as creditors can come
in at any time and ask for their money and Bob won’t
be able to pay them because his stock wouldn’t have
sold yet. I would recommend that Bob buy stock only
once it has been sold because you never know when
money is going to be needed and when stock won’t
sell.
, Jay Healy
Unit 5 Business Accounting
P5,M2 & D2
Rate of Stock Turnover Efficiency Average stock 32,500 x365 This links in with the acid ratio test. I said that Bob
x365 pppCost 148,000 wouldn’t have his money until his stock sold; but it
of = 80 days
Yes all depended on how long it would take to get that
goods sold money. From this calculation is says that it will take
80 days for Bob on average to sell the value of his
stock. This is a lot of days especially when you need
the money instantly. Of course the quicker the
better; the quicker Bob can get rid of his stock the
quicker he will make his profit. In order to do so I
would recommend that he hold less stock so he has
money to use just in case. Another option he has is
increasing the rate of his sales.
Creditor Days Efficiency Creditors 5,000 x365 Bob creditors accumulates to 5,000. From this
x365 153,000 payment period it will take Bob 12 days to this
Credit = 12 days
No amount out but considering that he gets money from
purchases debtors in a lot quicker time. In this situation Bob
could even take longer to pay off his creditors if he
wanted to but I would suggest that he doesn’t as he
has the money and people/ businesses want their
money as soon as possible. Delaying the payment will
release Bobs working capital and will enrage his
creditors such as suppliers who may end the
relationship because of it.
Debtor Days Efficiency Debtors 1,000 x365 Bobs debtors accumulates to 1,000. The payment
x365 350,000 period will only take 1 day for Bob to receive his
Credit sales = 1 day
No money. 1 day is a fantastic result for Bob because he
can receive this and quickly turn it into cash which
can then go towards paying off his creditors if
needed. Bob can later in the future compare his
debtor ratios in order to find trends. An upward
trend may be because he has offered longer credit
terms in order to attract more customers.
,Jay Healy
Unit 5 Business Accounting
P5,M2 & D2
2. Comment on the Financial Position of the company
Profitability: Profit wise Bobs Sports Bar is in a fantastic position with every ratio being positive. The gross profit shows that
Bob made 57p for every £1 made showing that Bob is getting good deals from suppliers and spending as less as possible. Once all
of Bob’s expenses have been deducted the net profit shows that Bob is still making profit. With a total of 19p profit for every £1
he makes. At the end of the year Bob’s sales totalled to £350,000 accumulating £66,500 profit at the end which is outstanding.
ROCE is also healthy for Bob as he makes back every single piece of money that was put into the business and more which shows
that he will be able to pay back the money that he invested into the business. Profit isn’t a problem for Bob; if he wanted to
make more profit I would recommend cutting down on expenses or try increasing prices slightly.
Liquidity: The gearing ratio is very good for Bob’s Sports Bar as the majority of the money he makes belongs to him. Only 21p
of every £1 made is borrowed. This is excellent as it emphasises that Bob can easily pay out any borrowed money that is owed.
The current ratio in my opinion is good and bad; good in the sense that Bob is able to spend £5.71 for every £1 that he owes
meaning he has bundles of cash to splash; but too much money can be a disadvantage, he has too many assets therefore money
is doing absolutely nothing and he should invested in expanding the business but it shows that they are in a stable position.
However the acid ratio isn’t satisfactory; as for every £1 of current liabilities Bob only has 70p worth of assets. This is extremely
bad for Bob as this means that he doesn’t have enough current assets to pay off short term liabilities because his stock is so
much; until he sells his stock he won’t have a positive acid ratio. This puts him at great danger as creditors can come in at any
time and ask for their money and Bob won’t be able to pay them because his stock hasn’t sold yet. I would recommend that Bob
buy stock only once it has been sold because you never know when money is going to be needed and when stock won’t sell.
Efficiency: The rate in which Bob can turn over the value of his stock it will take 80 days which is far too long in my opinion.
With the situation that Bob is in with the acid test he needs to sell his stock quicker in order to have spare money around just in
case his creditors come along and ask for their money. Speaking of creditors Bob pays them within 12 days which is okay as he
gets money from debtors in quicker time which will meant that money is available to pay them with. Debtors only take 1 day
which is a result for Bob; he will get his money near enough instantly which he can turn into cash which can go towards paying
creditors or other expenses that need paying.
,Jay Healy
Unit 5 Business Accounting
P5,M2 & D2
M2
The Performance
Gross Profit Margin: Bob’s gross profit margin was 57.71%. This is a very good result for Bob as its shows that for every £1 made, 57p
of that was profit. That’s more than half. Of course this is before any costs are deducted so Bob shouldn’t get to carried away; the final
amount of profit that Bob will be able to use on the business will be lower once the net profit has been calculated. But as long as the gross
profit is over 50% Bob is in a very strong positon. I would recommend in order to increase the gross profit margin that Bob either increase
the prices of his products as he will gain more money from the sales he makes or either reduce the direct costs of the sales.
Net Profit Margin: The net profit margin is the actual amount of profit that Bob makes and can actually use for himself as now all of the
expenses and costs that Bob has have been deducted. The final outcome was 19% which meant that Bob’s total profit for each £1 made
was 19p which again is good. Putting that onto a larger scale; Bob sales accumulated to £350,000 meaning that his profit for the year was
£68,780. Being in a positive net profit Bob is in a great position; it shows that his money coming into the business is greater than money
going out of the business so if he can keep doing that then he’s going to have no problems. Of course there’s always room for
improvement and to do so Bob can find cheaper alternatives with his expenses for try and reel in more money from his sales by
increasing the prices of his products.
Return on Capital Employed: The ROCE measures the profitability of Bob’s business; as long as the result is positive then Bob’s
business is profitable. And of course it was with a percentage of 126.22%. This gives Bob a great insight of just exactly how profitable his
business is. Comparing how much money has been made and how much has been put into the business Bob has made a massive profit as
his ratio of 126.22% shows. This means that Bob is able to repay back his investments after each financial year which makes loans and
grant much more acquirable as banks know from looking at this that Bob financially is extremely stable and will have no problem in the
future in paying back these loans.
Gearing Ratio: The ratio was 21% which meant that for every £1 Bob’s business has 21p of that was borrowed which is very pleasing for
Bob in the sense that the 21p can be easily paid back. Once Bob gives back the 21p this still leaves the business with 79p which is very
satisfactory. Knowing that he can pay back lenders shows that he is financially stable and is in a great position when it comes to standing
on his own two feet. Of course the main solution to not having to worry about this ratio is to stop borrowing money outright. But as a
starting business Bob needed to borrow money as a starting point but now having looked at his net profit he has already gained such a
substantial amount of money from profits he may now not have to borrow any which takes huge pressure of his shoulders.
Current Ratio: Bob’s current ratio is a funny one as it is good and bad. The current ratio for Bobs sports bar represents £5.71 of current
assets to every £1 of current liabilities which is good no money problems what so ever. However this shows that the value of his current
,Jay Healy
Unit 5 Business Accounting
P5,M2 & D2
assets is much higher than his current liabilities. This shows poor management in resources as well as his capital use as he has a lot of
assets going to waste as well as money as he has £3000 sitting in the bank doing absolutely nothing. The spare money and assets should
be used to expand the business further in order to gain even more money. I would recommend to Bob that he improves his sports bar in
order to attract more customers or maybe even open a new branch somewhere else to attract different types of people.
Acid Ratio: Shockingly, Bob’s business does have a few problems as the acid test shows a ratio of 0.71:1 meaning for every £1 of
liabilities Bob only has 71p worth of assets. This isn’t very good and this position doesn’t favour Bob what so ever. It shows that Bob
doesn’t have the ability to pay off any short term liabilities so for example when creditors come to Bob demanding for their money Bob is
not going to be able to pay them instantly because his stock hasn’t been sold just yet. Only once the stock has been sold will Bob have a
positive ratio. To ensure in the future that Bob doesn’t have this problem again I would advise that he take a much more cautious take
when buying stock, instead of buying bundles of stock in one go he should buy only once the stock has sold because you never know
when money will be needed and when stock won’t sell.
Stock Turnover: For Bob to turn over the value of his stock it will take him 80 days. This is kind of concerning considering he is in a
dangerous scenario with his acid test not being very good. He needs to sell his stock much faster because creditors can come at the most
unexpected time and if Bob hasn’t sold his stock he won’t be able to pay them. so of course the quicker the better; for Bob to do this I
would recommend next time to hold less stock so he has some money lying about or he has to increase his sales. Easier said than done
but he has too; advertising more is a great way to do exactly that.
Debtors Payment Period: It will only take 1 day for Bob to receive money from his debtors which is a fantastic result in my opinion; this
is possibly the quickest time a person/ business can repay someone par the same day of course so Bob should be very satisfied. Although
its only £1,000 this can go along way if the money is needed someplace else within the business; the fact that he gets it almost instantly
shows he is in control and he has a good relationship with his debtors. Getting these debts early means he can also quickly compare the
debtor day’s ratio with previous months or years to look for trends.
Creditors Payment Period: Considerably longer than the debtor’s period; Bob’s creditors accumulates to £5000. From this payment
period it will take Bob 12 days to pay out this money out but considering that he gets money from debtors in a lot quicker time he will
have some money to spend. In this case Bob can even take slightly longer to pay off his creditors if he wanted to gain some more money
but I would suggest that he doesn’t as he has the money anyway and people/ businesses want their money as soon as possible. Delaying
the payment will release Bob’s working capital and will enrage his creditors such as suppliers who may end the relationship because of it
and without suppliers Bob won’t have the equipment he needs in order to function.
,Jay Healy
Unit 5 Business Accounting
P5,M2 & D2
Conclusion
My overall opinion on the performance and position of Bob’s Sports Bar is a good one. For a start- up business he is doing very well
making £66,500 profit in his first year is something to be proud of, with his profitability ratios all being positive I would say that he has a
good future however being that throughout the year before all his profits have been made his assets were extremely lower than his
liabilities shows that he is holding on to too much stock and is getting a bit carried away with his purchasing. Luckily for him he was able
to sell all his stock as we can tell by the total sales he made but what happen if he can’t one year and his liabilities are higher than his
assets? Then what? Bob must take this into consideration ensuring that he doesn’t overload himself with stock because sometimes it
won’t sell.
D2
1.0Introduction
Now that I have analysed the position of Bob’s Sports Bar I will now evaluate the overall performance of it; including what impacted on
these results and why they are good and bad. I will also include a comparison of Bob’s Sports Bar with other businesses in general in
order to see just how well he is actually doing.
2.0Procedures
I have completed a ratio analysis table based on Bob’s Sports Bar showing all of the Bars ratios. I will use this to refer to when
discussing the performance of the Sports Bar. All notes I used to complete this table such as the formulas were collected during class. I
will now also use my evaluation from my M2 report in order to expand on it into this report.
3.0Findings
What are the ratios?
Gross Profit Margin: this is used to assess a company's financial health and business model by revealing the proportion of money left
over from revenues after accounting for the cost of goods sold. www.investopedia.com/terms/g/gross_profit_margin.asp
Net Profit Margin: this is the percentage of revenue left after all expenses have been deducted from sales. The measurement reveals
the amount of profit that a business can extract from its total sales. www.accountingtools.com/questions-and-answers/what-is-net-profit-
margin.html Return on Capital
Employed: this is considered to be the best measure of profitability. Indicates how much money is made by the business, compared to
how much money has been ‘put into’ the business.
, Jay Healy
Unit 5 Business Accounting
P5,M2 & D2
Current Ratio: this is a liquidity ratio that measures a company's ability to pay short-term and long-term obligations. To gauge this
ability, the current ratio considers the current total assets of a company relative to that company's current total liabilities.
www.investopedia.com/terms/c/currentratio.asp Acid Ratio Test: the
acid-test or quick ratio or liquidity ratio measures the ability of a company to use its near cash or quick assets to extinguish or retire its
current liabilities immediately. Quick assets include those current assets that presumably can be quickly converted to cash at close to
their book values. https://en.wikipedia.org/wiki/Quick_ratio
Gearing Ratio: this measures the proportion of a company's borrowed funds to its equity. The ratio indicates the financial risk to which a
business is subjected, since excessive debt can lead to financial difficulties. A high gearing ratio represents a high proportion of debt to
equity, and a low gearing ratio represents a low proportion of debt to equity. http://www.accountingtools.com/gearing-ratio
Debtor Payment Period: The debtor’s day’s ratio measures how quickly cash is being collected from debtors. Of course the longer it
takes for a company to collect, the greater the number of debtor’s days. https://en.wikipedia.org/wiki/Debtor_days
Creditor Payment Period: This ratio measures on average how long it takes for a business to pay for goods bought on credit; it is
expressed as a number in days. Stock Turnover: this is a ratio showing how many
times a company's inventory is sold and replaced over a period of time. The days in the period can then be divided by the inventory
turnover formula to calculate the days it takes to sell the inventory on hand. http://www.investopedia.com/terms/i/inventoryturnover.asp
Why use ratio analysis? – using a ratio analysis is fantastic as it allows Bob to see if his business is profitable which would be the
main goal. Of course there are other aspects of it which are:
Checking whether he has enough to money to pay his bills
If he could be paying its employees higher wages
Checking if he is paying his shares of tax
Checking if he is using his assets efficiently
Whether he has a gearing problem
Is the business a candidate for being bought by another company or investors
Which stakeholders will use ratio analysis? - Bob won’t be the only person interested in seeing his ratios, other people
within the business will also be eager… but why?
Managers: managers will use ratio analysis to get an overall perspective of how well the business is doing; they can look at each ratio
and see which is one is good and which one is bad and pinpoint why this is? Strengths and weaknesses of the business will be found out
Voordelen van het kopen van samenvattingen bij Stuvia op een rij:
Verzekerd van kwaliteit door reviews
Stuvia-klanten hebben meer dan 700.000 samenvattingen beoordeeld. Zo weet je zeker dat je de beste documenten koopt!
Snel en makkelijk kopen
Je betaalt supersnel en eenmalig met iDeal, creditcard of Stuvia-tegoed voor de samenvatting. Zonder lidmaatschap.
Focus op de essentie
Samenvattingen worden geschreven voor en door anderen. Daarom zijn de samenvattingen altijd betrouwbaar en actueel. Zo kom je snel tot de kern!
Veelgestelde vragen
Wat krijg ik als ik dit document koop?
Je krijgt een PDF, die direct beschikbaar is na je aankoop. Het gekochte document is altijd, overal en oneindig toegankelijk via je profiel.
Tevredenheidsgarantie: hoe werkt dat?
Onze tevredenheidsgarantie zorgt ervoor dat je altijd een studiedocument vindt dat goed bij je past. Je vult een formulier in en onze klantenservice regelt de rest.
Van wie koop ik deze samenvatting?
Stuvia is een marktplaats, je koop dit document dus niet van ons, maar van verkoper jayh34ly. Stuvia faciliteert de betaling aan de verkoper.
Zit ik meteen vast aan een abonnement?
Nee, je koopt alleen deze samenvatting voor €4,46. Je zit daarna nergens aan vast.