if you feel like it → paypal / buymeacoffee
, if you feel like it → paypal / buymeacoffee
Chapter 1 - Looking at Data - Distributions
1.1 Data
statistics → how we model uncertainty
→ summarizes quantitative data
→ helps make claims in the face of uncertainty
↳ since we can’t sample the whole population
General Terms
data → numerical or qualitative descriptions of an object
cases → the objects described by a set of data
↳ex: customers, subjects in a study, units in an experiment
label → a special variable used to differentiate the different cases
variable → a characteristic of a case
↳ different cases can have different values (levels) of the variables
categorical variable → places a case in one of several groups/categories
quantitative variable → takes numerical values (for which arithmetic operations make sense)
↳ needs a unit of measurement
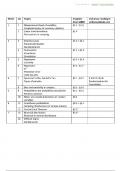
Key Characteristics of a Data Set
What and how many cases does the data describe? (WHO?)
How many variables do the data have, and what are their exact definitions? (WHAT?)
What purpose does the data have? Can we draw conclusions for other cases? Are the
variables suitable? (WHY?)
Operationalization
important questions about operationalization:
→ does the operationalization capture what I want to study?
→ how is my operationalization related to other researchers’ operationalizations?
→ is there a standard way to operationalize my variable?
→ is my operationalization easily measurable?
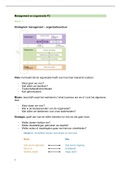
Measurement Scales
- choose the highest possible and meaningful (concerning content) scale
nominal scale → assigns observations to unordered categories
↳ ex: favorite color
- identities/labels (ex: gender, ID, …)
ordinal scale → assigns observations to ordered categories
↳ ex: satisfaction scale: (0) not satisfied at all → (9) very satisfied
- categorical: ex: how good are you in sports: good, satisfactory, poor
interval/ratio scale → assigns scores on a scale with quantitative information
↳ ex: how many siblings do you have? 1,2,3,4,5,6,7,8,9,………
- outcomes of calculations are sensible (ex: mean score = 5.2)
↳ has a true zero point
, if you feel like it → paypal / buymeacoffee
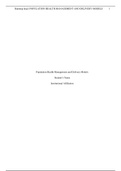
nominal ordinal interval ratio
categorizes and labels variables ✔ ✔ ✔ ✔
ranks categories in order ✔ ✔ ✔
has known, equal intervals ✔ ✔
has a true or meaningful zero ✔
Discrete vs. Continuous Measures
discrete data → “between” numbers are meaningless (without decimals)
↳ ex: how many siblings do you have: “2” and “3” are possible answers, but “2.5” is not
continuous data → “between” numbers have meaning (can have decimals)
↳ ex: how tall are you: all positive real numbers are meaningful answers
- nominal and ordinal scales tend to be discrete
1.2 Displaying distributions with graphs
exploratory data analysis → examining data to describe their main features
↳ by summarizing the data graphically
↳ or by summarizing characteristics of data with numbers
distribution of a variable → what values does the variable take and how often does it take them
- the choice for certain plots/graphs depends on the measurement scale/level of the variable:
nominal and ordinal scales interval and ratio scales
bar graph pie chart stemplot histogram
Distribution of Categorical Variables
- pie charts or bar graphs give counts or percents/proportion of cases that fall in each
category
Distribution of Quantitative Variables
stemplots (stem-and-leaf-plots)
- give a picture of a distribution while including the actual numerical values (best for small
numbers of observations, all above 0)
→ stem: consisting of all but the final digit of a value, written in a vertical column
→ leaf: final digit, in rows to the right of the stem (increasing order)
→ back to back stemplot: different datasets are written on both sides of the stem
, if you feel like it → paypal / buymeacoffee
Chapter 1 - Looking at Data - Distributions
1.1 Data
statistics → how we model uncertainty
→ summarizes quantitative data
→ helps make claims in the face of uncertainty
↳ since we can’t sample the whole population
General Terms
data → numerical or qualitative descriptions of an object
cases → the objects described by a set of data
↳ex: customers, subjects in a study, units in an experiment
label → a special variable used to differentiate the different cases
variable → a characteristic of a case
↳ different cases can have different values (levels) of the variables
categorical variable → places a case in one of several groups/categories
quantitative variable → takes numerical values (for which arithmetic operations make sense)
↳ needs a unit of measurement
Key Characteristics of a Data Set
What and how many cases does the data describe? (WHO?)
How many variables do the data have, and what are their exact definitions? (WHAT?)
What purpose does the data have? Can we draw conclusions for other cases? Are the
variables suitable? (WHY?)
Operationalization
important questions about operationalization:
→ does the operationalization capture what I want to study?
→ how is my operationalization related to other researchers’ operationalizations?
→ is there a standard way to operationalize my variable?
→ is my operationalization easily measurable?
Measurement Scales
- choose the highest possible and meaningful (concerning content) scale
nominal scale → assigns observations to unordered categories
↳ ex: favorite color
- identities/labels (ex: gender, ID, …)
ordinal scale → assigns observations to ordered categories
↳ ex: satisfaction scale: (0) not satisfied at all → (9) very satisfied
- categorical: ex: how good are you in sports: good, satisfactory, poor
interval/ratio scale → assigns scores on a scale with quantitative information
↳ ex: how many siblings do you have? 1,2,3,4,5,6,7,8,9,………
- outcomes of calculations are sensible (ex: mean score = 5.2)
↳ has a true zero point
, if you feel like it → paypal / buymeacoffee
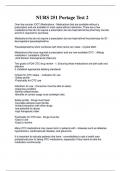
nominal ordinal interval ratio
categorizes and labels variables ✔ ✔ ✔ ✔
ranks categories in order ✔ ✔ ✔
has known, equal intervals ✔ ✔
has a true or meaningful zero ✔
Discrete vs. Continuous Measures
discrete data → “between” numbers are meaningless (without decimals)
↳ ex: how many siblings do you have: “2” and “3” are possible answers, but “2.5” is not
continuous data → “between” numbers have meaning (can have decimals)
↳ ex: how tall are you: all positive real numbers are meaningful answers
- nominal and ordinal scales tend to be discrete
1.2 Displaying distributions with graphs
exploratory data analysis → examining data to describe their main features
↳ by summarizing the data graphically
↳ or by summarizing characteristics of data with numbers
distribution of a variable → what values does the variable take and how often does it take them
- the choice for certain plots/graphs depends on the measurement scale/level of the variable:
nominal and ordinal scales interval and ratio scales
bar graph pie chart stemplot histogram
Distribution of Categorical Variables
- pie charts or bar graphs give counts or percents/proportion of cases that fall in each
category
Distribution of Quantitative Variables
stemplots (stem-and-leaf-plots)
- give a picture of a distribution while including the actual numerical values (best for small
numbers of observations, all above 0)
→ stem: consisting of all but the final digit of a value, written in a vertical column
→ leaf: final digit, in rows to the right of the stem (increasing order)
→ back to back stemplot: different datasets are written on both sides of the stem