Tests
z-test
1. Purpose
relating a sample to a population
compute the difference between a sample and the population in SD’s
sample mean m is compared to population mean μ
2. Kind of data
Numerical: Interval or ratio
3.Requirements
The mean and SD for a population (mu and sigma) are known
The measurement level needs to be interval or ratio
The data needs to be normally distributed or n >30
Data points are independent: A single case cannot be repeated. This means that everyone is only
measured once (otherwise you need a two-sided test)
The observations are randomly selected
4. Degrees of freedom
Not relevant for z-test
5. Hypotheses
H0: m= μ (sample mean = population mean)
Ha: m≠ μ (sample mean population mean)
o right-tailed: P (m≥ μ), critical z= 1,64
o left-tailed: P(m< μ), critical z= - 1,64
o two-tailed: P(m<> μ), 2.5% lowest or 2.5% highest values are significant
6. Explanation
Z-value:
,step 1: calculate the z-score (standardize)
step 2: calculate the chance at the sample (p-value)
7. Effect size
Not relevant for z-test
8. Example
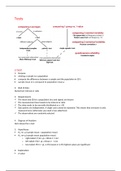
one-sided z-test:
the z-score equals 2
the chance of a sample with m≥74=2.35+0.15=2.5%
Since 2,5% is smaller than 5%, we can reject the H 0
So there is a 2,5% chance that the result is due to Confounding factors: other factors that made the
children better at language, that are not CALL
For the chance that the results are coincidental, the p-value is important
The p-value is the chance of a certain value given that H 0 is true.
P-value in R:
we only look at the higher tail, because we expected a positive effect in our alternative hypothesis
So there is only a 2.28% chance that our findings were due to chance CALL is probably helping
,t-test
1. Purpose
Compare the mean of two groups (or series of values), or one mean vs one value, and determine
whether the difference is significant
State the difference in means in SE’s
3 types of t-tests:
o Single sample t-test: compare a sample to a fixed value (often population mean)
o Independent samples t-test: compare means of two different groups
o Paired samples t-test
2. Kind of data
numerical(Because we need to compute a mean)
3. Requirements
! for all t-tests: normal distribution (or n >30). If not: non-parametric test
Single
Data needs to be randomly selected from population
Data needs to be measured at interval/ratio scale.
Independent observations: f.e. no 2 persons should be measured twice
Observations approximately normally distributed or n > 30
Independent
Data needs to be randomly selected from population
Data needs to be measured at interval/ratio scale (numerical).
Because: we need to compute a mean
Independent observations between and within groups (same people should not be in both
groups f.e.)
Observations of both samples are approximately normally distributed (or n > 30)
Variances are homogeneous: the values need to be spread out similarly in both groups
In R, the function t.test() includes an adjustment to correct unequal variances, so this is done
automatically
Paired
Data needs to be randomly selected from population
Data needs to be measured at interval/ratio scale.
Independent observations: f.e. no 2 persons should be measured twice
Observations approximately normally distributed (or n > 30)
Independent observations within groups (but paired between: same people measured twice)
Scores measured on same scale (it’s f.e. not possible to compare numbers to percentages)
4. Degrees of freedom
Single data: n - 1
Independent data: (n1 – 1) + (n2 – 1)
Paired data: npaired – 1
, Written as t(df)
5. Hypotheses
Single sample
o H0: μ = μ0
o Ha: μ ≠ μ0
(μ0 = population mean)
Paired
o (There is no difference between the variables x and y)
o
Independent
o H0: μ1 = μ2 the mean of both groups is the same
o Two sided Ha: μ1 ≠ μ2 the mean of group 1 an d 2 is not the same
o Left-tailed Ha: μ1 < μ2 the mean of group 1 is smaller than the mean of group 2
o Right-tailed Ha: μ1 > μ2 the mean of group 1 is bigger than the mean of group 2
6. Explanation
Simple t-statistic (t-value): or
step 1: check if the assumptions are met
step 2: visualisation using boxplot
step 3: calculation of t-value and p-value
step 4: effect size
7. Effect size
Cohen’s d
o negligible < 0.2
o 0.2 < small < 0.5
o 0.5 < medium < 0.8
o large > 0.8
z-test
1. Purpose
relating a sample to a population
compute the difference between a sample and the population in SD’s
sample mean m is compared to population mean μ
2. Kind of data
Numerical: Interval or ratio
3.Requirements
The mean and SD for a population (mu and sigma) are known
The measurement level needs to be interval or ratio
The data needs to be normally distributed or n >30
Data points are independent: A single case cannot be repeated. This means that everyone is only
measured once (otherwise you need a two-sided test)
The observations are randomly selected
4. Degrees of freedom
Not relevant for z-test
5. Hypotheses
H0: m= μ (sample mean = population mean)
Ha: m≠ μ (sample mean population mean)
o right-tailed: P (m≥ μ), critical z= 1,64
o left-tailed: P(m< μ), critical z= - 1,64
o two-tailed: P(m<> μ), 2.5% lowest or 2.5% highest values are significant
6. Explanation
Z-value:
,step 1: calculate the z-score (standardize)
step 2: calculate the chance at the sample (p-value)
7. Effect size
Not relevant for z-test
8. Example
one-sided z-test:
the z-score equals 2
the chance of a sample with m≥74=2.35+0.15=2.5%
Since 2,5% is smaller than 5%, we can reject the H 0
So there is a 2,5% chance that the result is due to Confounding factors: other factors that made the
children better at language, that are not CALL
For the chance that the results are coincidental, the p-value is important
The p-value is the chance of a certain value given that H 0 is true.
P-value in R:
we only look at the higher tail, because we expected a positive effect in our alternative hypothesis
So there is only a 2.28% chance that our findings were due to chance CALL is probably helping
,t-test
1. Purpose
Compare the mean of two groups (or series of values), or one mean vs one value, and determine
whether the difference is significant
State the difference in means in SE’s
3 types of t-tests:
o Single sample t-test: compare a sample to a fixed value (often population mean)
o Independent samples t-test: compare means of two different groups
o Paired samples t-test
2. Kind of data
numerical(Because we need to compute a mean)
3. Requirements
! for all t-tests: normal distribution (or n >30). If not: non-parametric test
Single
Data needs to be randomly selected from population
Data needs to be measured at interval/ratio scale.
Independent observations: f.e. no 2 persons should be measured twice
Observations approximately normally distributed or n > 30
Independent
Data needs to be randomly selected from population
Data needs to be measured at interval/ratio scale (numerical).
Because: we need to compute a mean
Independent observations between and within groups (same people should not be in both
groups f.e.)
Observations of both samples are approximately normally distributed (or n > 30)
Variances are homogeneous: the values need to be spread out similarly in both groups
In R, the function t.test() includes an adjustment to correct unequal variances, so this is done
automatically
Paired
Data needs to be randomly selected from population
Data needs to be measured at interval/ratio scale.
Independent observations: f.e. no 2 persons should be measured twice
Observations approximately normally distributed (or n > 30)
Independent observations within groups (but paired between: same people measured twice)
Scores measured on same scale (it’s f.e. not possible to compare numbers to percentages)
4. Degrees of freedom
Single data: n - 1
Independent data: (n1 – 1) + (n2 – 1)
Paired data: npaired – 1
, Written as t(df)
5. Hypotheses
Single sample
o H0: μ = μ0
o Ha: μ ≠ μ0
(μ0 = population mean)
Paired
o (There is no difference between the variables x and y)
o
Independent
o H0: μ1 = μ2 the mean of both groups is the same
o Two sided Ha: μ1 ≠ μ2 the mean of group 1 an d 2 is not the same
o Left-tailed Ha: μ1 < μ2 the mean of group 1 is smaller than the mean of group 2
o Right-tailed Ha: μ1 > μ2 the mean of group 1 is bigger than the mean of group 2
6. Explanation
Simple t-statistic (t-value): or
step 1: check if the assumptions are met
step 2: visualisation using boxplot
step 3: calculation of t-value and p-value
step 4: effect size
7. Effect size
Cohen’s d
o negligible < 0.2
o 0.2 < small < 0.5
o 0.5 < medium < 0.8
o large > 0.8