100% tevredenheidsgarantie Direct beschikbaar na betaling Zowel online als in PDF Je zit nergens aan vast
logo-home
Complete summary Statistics course! (step-by-step) - Grade: 8,1! €5,98   In winkelwagen

Samenvatting

Complete summary Statistics course! (step-by-step) - Grade: 8,1!

 99 keer bekeken  5 keer verkocht

This summary provides you with all the theory from the Statistics course. All tests are explained step-by-step, including the APA standards of reporting. Besides, the basics of variables and graphs are also explained. As the exam is open-book (this year), you are allowed to keep this with you.

Voorbeeld 3 van de 30  pagina's

  • 23 november 2020
  • 30
  • 2020/2021
  • Samenvatting
Alle documenten voor dit vak (9)
avatar-seller
maureengribnau
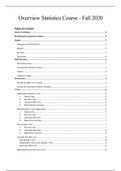
Overview Statistics Course - Fall 2020
Table of content
Levels of variables........................................................................................................................................... 3
Recoding and Computing variables ................................................................................................................. 3
Graphs ............................................................................................................................................................ 3
Histogram and PP/QQ plots ............................................................................................................................... 3
Boxplot................................................................................................................................................................ 4

Bar chart ............................................................................................................................................................. 4
Scatterplot .......................................................................................................................................................... 4
Exploring data................................................................................................................................................. 4
Normality testing ................................................................................................................................................ 4
Homogeneity (Variance Ratio) ........................................................................................................................... 4
Outliers ............................................................................................................................................................... 5

Cronbach’s alpha ................................................................................................................................................ 5
Kind of tests.................................................................................................................................................... 5

Testing the effect on a variable .......................................................................................................................... 5
Testing the association between variables ......................................................................................................... 5
T-Test ............................................................................................................................................................. 6
Independent-Samples T-Test .............................................................................................................................. 6
1. Explore data ......................................................................................................................................... 6
2. Run the t-test ....................................................................................................................................... 6
3. Calculate effect size .............................................................................................................................. 6
4. Reporting the outcomes....................................................................................................................... 6
Paired-Samples T-Test (dependent) .................................................................................................................... 6
1. Explore data ......................................................................................................................................... 7
2. Run the t-test ....................................................................................................................................... 7
3. Calculate effect size .............................................................................................................................. 7
4. Report the outcomes ........................................................................................................................... 7
One-Sample T-Test.............................................................................................................................................. 7
1. Run the t-test ....................................................................................................................................... 7
2. Calculate effect size .............................................................................................................................. 8
3. Report the outcomes ........................................................................................................................... 8
Calculate the effect size ...................................................................................................................................... 8
One-Sample T-test ......................................................................................................................................... 8
Independent- and Paired-Samples T-test ...................................................................................................... 8
Outcomes effect size ..................................................................................................................................... 8
Reporting the outcomes of a t-test ..................................................................................................................... 8

, 2

ANOVA ........................................................................................................................................................... 9

One-way ANOVA................................................................................................................................................. 9
1. Prepare data ....................................................................................................................................... 10
2. Explore data ....................................................................................................................................... 10
3. Run the test ........................................................................................................................................ 10
4. Follow-up tests ................................................................................................................................... 10
5. Calculate effect size ............................................................................................................................ 10
6. Report the outcomes ......................................................................................................................... 11
Factorial ANOVA ............................................................................................................................................... 12
1. Prepare data ....................................................................................................................................... 12
2. Explore data ....................................................................................................................................... 12
3. Run the test ........................................................................................................................................ 13
4. Understanding the test outcomes...................................................................................................... 13
5. Follow-up analysis .............................................................................................................................. 13
6. Calculate effect size ............................................................................................................................ 16
7. Report the outcomes ......................................................................................................................... 17
8. Splitting and merging independent variables .................................................................................... 17
Chi-Square Test ............................................................................................................................................. 20
Chi-Square test of Association .......................................................................................................................... 20
Chi-Square test of Association in SPSS ......................................................................................................... 21
Calculate effect size ..................................................................................................................................... 21
Reporting Chi-Square test of Association .................................................................................................... 22
Chi-Square Goodness-of-fit ............................................................................................................................... 22
Chi-Square Goodness-of-fit in SPSS ............................................................................................................. 22
Reporting Chi-Square Goodness-of-fit ......................................................................................................... 22
Correlation Coefficient .................................................................................................................................. 23
Outcome correlation coefficient ....................................................................................................................... 23
Positive correlation ...................................................................................................................................... 23
Negative correlation .................................................................................................................................... 23
Zero correlation ........................................................................................................................................... 23
Strength of the correlation .......................................................................................................................... 23
Correlation in SPSS ............................................................................................................................................ 24
1. Explore data ....................................................................................................................................... 24
2. Run the test ........................................................................................................................................ 24
3. Visualizing correlation ........................................................................................................................ 24
4. Effect size ........................................................................................................................................... 25
5. Report the outcome ........................................................................................................................... 25
Partial correlation ............................................................................................................................................. 25
1. Run the test ........................................................................................................................................ 25
Simple Linear Regression .............................................................................................................................. 26
Regression analysis in SPSS............................................................................................................................... 27
1. Assumptions ....................................................................................................................................... 28
2. Running the regression analysis ......................................................................................................... 30
3. Reporting the outcome ...................................................................................................................... 30

, 3


Levels of variables
Categorial variable: it is a variable of one kind, so either human or animal for example.
Continuous variable: one that can give scores for each person and can take on any value of
measurement scale that is used.
Nominal: scales are used for labeling variables, without any quantitative data.
Ordinal: the order of the values is what’s important and significant, but the differences
between each other are not really known. ‘On a scale of 1 to 10’, we know what is better but
not how much.
Interval: numeric scales in which we know the order and the exact differences between the
values, however, there is no absolute zero.
Ratio: they tell us about the order, the exact value between units and they also have an
absolute zero. We can also calculate with it.


Recoding and Computing variables
Recoding to different variables is used when the meaning of the value labels for related
variables are not the same. E.g. within a survey, different questions about happiness are asked
but some in a negative way and some in a positive way but on the same kind of scale. In this
case, the positive OR negative variables need to be recoded, so they have the same meaning
on the scale.
Computing a new variable is used when for example a MEAN score has to be calculated for
multiple existing variables. E.g. a MEAN_Happiness can be created by adding up all the
different variables (after recoding them!) so there is a mean for the happiness variables.
Steps: statistical – mean. Also, computing a new variable can be created to measure the
difference between happiness and sadness. Name: Diff_Happ_Sad and the formula would be
MEAN_Happiness-MEAN_Sadness.


Graphs
Histogram and PP/QQ plots
These are useful to explore how a continuous variable is distributed. You can explore the
skewness and kurtosis of the distribution, see whether it is normally distributed (normal
curve) and whether it has outliers. When you use plots to present the distribution, the data
should be on the line.

Voordelen van het kopen van samenvattingen bij Stuvia op een rij:

Verzekerd van kwaliteit door reviews

Verzekerd van kwaliteit door reviews

Stuvia-klanten hebben meer dan 700.000 samenvattingen beoordeeld. Zo weet je zeker dat je de beste documenten koopt!

Snel en makkelijk kopen

Snel en makkelijk kopen

Je betaalt supersnel en eenmalig met iDeal, creditcard of Stuvia-tegoed voor de samenvatting. Zonder lidmaatschap.

Focus op de essentie

Focus op de essentie

Samenvattingen worden geschreven voor en door anderen. Daarom zijn de samenvattingen altijd betrouwbaar en actueel. Zo kom je snel tot de kern!

Veelgestelde vragen

Wat krijg ik als ik dit document koop?

Je krijgt een PDF, die direct beschikbaar is na je aankoop. Het gekochte document is altijd, overal en oneindig toegankelijk via je profiel.

Tevredenheidsgarantie: hoe werkt dat?

Onze tevredenheidsgarantie zorgt ervoor dat je altijd een studiedocument vindt dat goed bij je past. Je vult een formulier in en onze klantenservice regelt de rest.

Van wie koop ik deze samenvatting?

Stuvia is een marktplaats, je koop dit document dus niet van ons, maar van verkoper maureengribnau. Stuvia faciliteert de betaling aan de verkoper.

Zit ik meteen vast aan een abonnement?

Nee, je koopt alleen deze samenvatting voor €5,98. Je zit daarna nergens aan vast.

Is Stuvia te vertrouwen?

4,6 sterren op Google & Trustpilot (+1000 reviews)

Afgelopen 30 dagen zijn er 73918 samenvattingen verkocht

Opgericht in 2010, al 14 jaar dé plek om samenvattingen te kopen

Start met verkopen
€5,98  5x  verkocht
  • (0)
  Kopen