Lecture Notes Systems Thinking, Scenarios
& Indicators for SD
Lecture 1: Introduction
09/11/2020
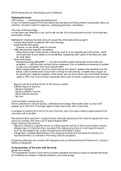
Setting goals and reaching targets
SD policy is often goal-oriented
• How can we use science for SD to inform policy goals?
• To reach any goal, four questions need to be answered
o What is our goal and when do we want to achieve this goal?
▪ Goals and targets are often set in (international) politics
• UN Paris climate agreement
• SDGs
• MDGs
• Montreal protocol
▪ International goals reflect scientific consensus on the issue, but also, they
require societal support in order for politicians to sign these goals
o What is our goal in measurable units?
▪ Develop the right indicator
• Indicators should be measurable
• Data should be available in terms of trend over time
• Indicators should be possible to link with models
▪ Indicators are more than a simple metric. Ideally, indicators are linked to a
model framework through which policy effects are explored and updated based
on new insights and developments.
▪ Develop the right indicator
• Indicators should be measurable
• Data should be available in terms of trend over time
• Indicators should be possible to link with models
o Where are we now?
▪ Find reliable and sufficient data on the developed indicators
▪ Interpreting indicator requires in-depth knowledge on how the state of the
system is reflected by the metrics
o What do we need to do/change to achieve the goal?
▪ Outlining effective policy requires knowledge on how the system will respond to
future actions
• Historic responses as analogy for future
• Mechanistic process-based models of the system
• Expert knowledge
, • Effects of different policies can be explored in scenario-based model
analyses
• Indicators: help quantity goals and assess historic development
• Modelling: requires and contributes to system understanding
• Models: are used to explore the future effects op policy options
System perspective on decision making
• The goal-oriented approach to SD ca be summarized in terms of a decision-making system
• Past to present historic data, data collection and analysis
• Present and future: system understanding, scenario-based modelling
Lecture 2: Modelling growth
12/11/2020
,ICAP lens: seeing them as Innovation systems, Complex systems, Adaptive systems and Political systems
, Modelling exponential growth
• The Anthropocene
• Differential equation: Dy/dt = b · Y
• Why exponential growth of populations?
o Due to positive feedbacks --> change over time
(Dy/dt) is a constant faction (b) of the state Y
Differential equations: dY/dt = b·Y
• Y = Amount of Y. State variable or stock
• dY = change in amount of Y (Y). Rate variable, or flow, or flux
• dt = change in time, or time step
• b = Relative growth constant (parameter)
Units:
• In which state Y are amounts of Y, e.g. [m3], [kg], [people], etc.
• dY/dt is a rate, so [kg/day], [m3 /s], [people/year], etc.
• b is the relative rate of change e.g. [people/people/year = [1/year], or [year-1]
• Dimensions and units need to match between terms
• e.g. interest on bank account parameter a = 2%. This means 2€/100€/year = 0.02/year, or 0.02
[year-1].
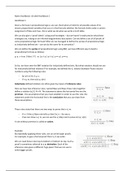
How to model exponential growth?
• Differential equations: dY/dt = b·Y
• Example: interest on bank account
o Y = 100€, with time step (dt) of 1 year (interest calculated after 1 year)
o Interest rate b = 10% = 10€/100€/year = 0.1 [/year] or [year-1]
o Calculate change over time: dY/dt = b*Y, change in Y dY = b*Y*dt
o Change in Y (in €) over dt (one year) = 0.1*100*1 = 10 €/year
o New state of Y(t+1 year)= Y+dY*dt = 100 +10*1=110 €
& Indicators for SD
Lecture 1: Introduction
09/11/2020
Setting goals and reaching targets
SD policy is often goal-oriented
• How can we use science for SD to inform policy goals?
• To reach any goal, four questions need to be answered
o What is our goal and when do we want to achieve this goal?
▪ Goals and targets are often set in (international) politics
• UN Paris climate agreement
• SDGs
• MDGs
• Montreal protocol
▪ International goals reflect scientific consensus on the issue, but also, they
require societal support in order for politicians to sign these goals
o What is our goal in measurable units?
▪ Develop the right indicator
• Indicators should be measurable
• Data should be available in terms of trend over time
• Indicators should be possible to link with models
▪ Indicators are more than a simple metric. Ideally, indicators are linked to a
model framework through which policy effects are explored and updated based
on new insights and developments.
▪ Develop the right indicator
• Indicators should be measurable
• Data should be available in terms of trend over time
• Indicators should be possible to link with models
o Where are we now?
▪ Find reliable and sufficient data on the developed indicators
▪ Interpreting indicator requires in-depth knowledge on how the state of the
system is reflected by the metrics
o What do we need to do/change to achieve the goal?
▪ Outlining effective policy requires knowledge on how the system will respond to
future actions
• Historic responses as analogy for future
• Mechanistic process-based models of the system
• Expert knowledge
, • Effects of different policies can be explored in scenario-based model
analyses
• Indicators: help quantity goals and assess historic development
• Modelling: requires and contributes to system understanding
• Models: are used to explore the future effects op policy options
System perspective on decision making
• The goal-oriented approach to SD ca be summarized in terms of a decision-making system
• Past to present historic data, data collection and analysis
• Present and future: system understanding, scenario-based modelling
Lecture 2: Modelling growth
12/11/2020
,ICAP lens: seeing them as Innovation systems, Complex systems, Adaptive systems and Political systems
, Modelling exponential growth
• The Anthropocene
• Differential equation: Dy/dt = b · Y
• Why exponential growth of populations?
o Due to positive feedbacks --> change over time
(Dy/dt) is a constant faction (b) of the state Y
Differential equations: dY/dt = b·Y
• Y = Amount of Y. State variable or stock
• dY = change in amount of Y (Y). Rate variable, or flow, or flux
• dt = change in time, or time step
• b = Relative growth constant (parameter)
Units:
• In which state Y are amounts of Y, e.g. [m3], [kg], [people], etc.
• dY/dt is a rate, so [kg/day], [m3 /s], [people/year], etc.
• b is the relative rate of change e.g. [people/people/year = [1/year], or [year-1]
• Dimensions and units need to match between terms
• e.g. interest on bank account parameter a = 2%. This means 2€/100€/year = 0.02/year, or 0.02
[year-1].
How to model exponential growth?
• Differential equations: dY/dt = b·Y
• Example: interest on bank account
o Y = 100€, with time step (dt) of 1 year (interest calculated after 1 year)
o Interest rate b = 10% = 10€/100€/year = 0.1 [/year] or [year-1]
o Calculate change over time: dY/dt = b*Y, change in Y dY = b*Y*dt
o Change in Y (in €) over dt (one year) = 0.1*100*1 = 10 €/year
o New state of Y(t+1 year)= Y+dY*dt = 100 +10*1=110 €