100% tevredenheidsgarantie Direct beschikbaar na betaling Zowel online als in PDF Je zit nergens aan vast
logo-home
Summary GRS-10306 introduction geo-information science 20/21 €4,99   In winkelwagen

Samenvatting

Summary GRS-10306 introduction geo-information science 20/21

1 beoordeling
 65 keer bekeken  2 keer verkocht

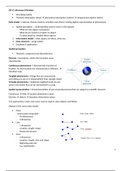
A summary of GRS-10306 introduction geo-information science, it includes all the content of the lectures, modules and the reader.

Voorbeeld 3 van de 18  pagina's

  • Ja
  • 26 januari 2021
  • 18
  • 2020/2021
  • Samenvatting
book image

Titel boek:

Auteur(s):

  • Uitgave:
  • ISBN:
  • Druk:
Alle documenten voor dit vak (1)

1  beoordeling

review-writer-avatar

Door: merelbosker1 • 1 jaar geleden

avatar-seller
xira
GIS L1 afternoon (Monday)

 Describing reality
 Thematic description (what)  geometrical description (where)  temporal description (when)

Data model = captures choices made by scientists and others creating digital representation of phenomena.

1. Spatial perception = understanding what to store in the dataset.
- What are the objects considered
- What do you need to consider an object
- To what detail to consider these objects
2. Information model = what aspects of where, when etc.
3. Data structure = assign tables
4. Database & application

Spatial perception

 Thematic, categorical and discontinuous

Discrete = boundaries, within the boundary same
characteristic

Continuous phenomena = characteristics function of
location. At each location the characteristic is different. 
elevation map.

Tangible phenomena = things that are very present .
everything you see on a topographical map. (google maps)
Virtually phenomena = statistical neighborhoods, do not
exist in real world. But can be represented in a map.

Spatial representation = formal description of perceived phenomena that are subject to scientific research

Continuous  field  location determines values
Discrete  objects  boundary determines values

Two approaches: raster and vector (can be used to store objects and fields).

Objects in the vector data model

 Point
- only location important
- No dimensions
- 0 dimension
 Line
- 1 dimension
- Location, length, shape
- Roads and streams
 Area
- 2 dimension,
- Location, length, area and shape
- Beginning and end
- E.g. waterbodies
1

,Vector = represented as a point.

Raster = consist has matrix or square cells. Aerial photographs, or satellite.
Point = single cell
Line = sequence of neighboring cells
Area  collection of contiguous cells


L2 morning (Tuesday)

Attribute = name, species, age of tree
Features = area of land (land use)

Features can be explained in vector or raster (cells have same function)

Geometry

 Location and orientation (coordinate system)
- X and Y
 Shape and size
- Rectangular, triangular etc. It can have a size and length
 Topology = how entities are related to each other in the real
world. Or spatial relationship between objects and between
primitives of the geometry representation ( points, line etc.)
- The wardrobe words, from-to, inside-outside
- Relative location of spatial objects
- Invariant for coordinate transformation
- Relations: point-point, point-line, point-area


How stored in GIS

 Relative relations between objects, don’t change when coordinate change

Shape file
Shape file has no topology

Qualitive = what is it and what is the order
nominal  difference  text field
Ordinal  order  higher, lower
2

, Quantitive

 Interval doesn’t have an absolute point of zero, can go below 0 (degrees Celsius)
 Ratio = cannot below 0. (speed in m/s)

Relational data model = collection of tables that can be related to
each other by key attributes who values uniquely identify a record
in a table.

Two tables can be joined when 1:1 or many : 1. A primary key has
to be defined. This is when they have a share attribute. Related
tables the unique identifier connect to other identifier 1: many.

Merge = database system creates its own primary key.

Raster

 Integer raster (location based) whole numbers
- Nominal, ordinal
- Discrete data/ discontinuous  building, lake
- Value attribute table
 Floating point rater = number with decimals
- interval ratio
- Continuous data
- No value attribute table = value itself has the meaning of the phenomena itself. The values can be
infinite lake depth

Region = cluster of cells with the same value
Zone = all regions with the same value

L2 afternoon

How to get data

 Harvesting data by the web
- Portals: data framework
- Spatial data infrastructure = technology, policy, standards
- Meta data
 Handling
 In situ (field measurements)

SDI = coordinated series of agreements on: standards, policies and technologies to support efficient use of geo-data.
Facilitation and coordination of finding, exchange and sharing (accessible) of geodata.

The people are the users of the data. Inspire is the European Union spatial data infrastructure, to make sharing spatial
information with public sector better and facilitate public accesses.

Web service has 3 levels: accesses of web services, interoperability by web services, servers with data and metadata.

- Web map service = visualize the data, but no download feature (kinda pdf)
- Web feature service = download, visualize and edit data

Meta data = description of the data

3

Voordelen van het kopen van samenvattingen bij Stuvia op een rij:

Verzekerd van kwaliteit door reviews

Verzekerd van kwaliteit door reviews

Stuvia-klanten hebben meer dan 700.000 samenvattingen beoordeeld. Zo weet je zeker dat je de beste documenten koopt!

Snel en makkelijk kopen

Snel en makkelijk kopen

Je betaalt supersnel en eenmalig met iDeal, creditcard of Stuvia-tegoed voor de samenvatting. Zonder lidmaatschap.

Focus op de essentie

Focus op de essentie

Samenvattingen worden geschreven voor en door anderen. Daarom zijn de samenvattingen altijd betrouwbaar en actueel. Zo kom je snel tot de kern!

Veelgestelde vragen

Wat krijg ik als ik dit document koop?

Je krijgt een PDF, die direct beschikbaar is na je aankoop. Het gekochte document is altijd, overal en oneindig toegankelijk via je profiel.

Tevredenheidsgarantie: hoe werkt dat?

Onze tevredenheidsgarantie zorgt ervoor dat je altijd een studiedocument vindt dat goed bij je past. Je vult een formulier in en onze klantenservice regelt de rest.

Van wie koop ik deze samenvatting?

Stuvia is een marktplaats, je koop dit document dus niet van ons, maar van verkoper xira. Stuvia faciliteert de betaling aan de verkoper.

Zit ik meteen vast aan een abonnement?

Nee, je koopt alleen deze samenvatting voor €4,99. Je zit daarna nergens aan vast.

Is Stuvia te vertrouwen?

4,6 sterren op Google & Trustpilot (+1000 reviews)

Afgelopen 30 dagen zijn er 72042 samenvattingen verkocht

Opgericht in 2010, al 14 jaar dé plek om samenvattingen te kopen

Start met verkopen
€4,99  2x  verkocht
  • (1)
  Kopen