100% tevredenheidsgarantie Direct beschikbaar na betaling Zowel online als in PDF Je zit nergens aan vast
logo-home
Summary Python courses programming for economists €3,39
In winkelwagen

Samenvatting

Summary Python courses programming for economists

 57 keer bekeken  3 keer verkocht

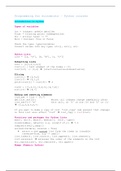
This is a summary of the "Python"-part of the course: Programming for economists given at Tilburg University. The documents contains a summary of the theory and codes needed to do the exercises in Python.

Laatste update van het document: 3 jaar geleden

Voorbeeld 3 van de 13  pagina's

  • 8 februari 2021
  • 8 februari 2021
  • 13
  • 2019/2020
  • Samenvatting
Alle documenten voor dit vak (2)
avatar-seller
lisaholling1
Programming for economists – Python courses
Introduction to Python

Types of variables

Int = integer: gehele getallen
Float = floating point: kommagetallen
Str = string: tekst -> “”
Bool = boolean: True or False

Check the type: type(variable)
Convert values into any type: str(), int(), etc.


Pyhton Lists
List = [[a, “a”], [b, “b”], [c, “c”]]

Subsetting lists
List = [0,1,2,3,4,5]
list[-1] : last element of the index = [5]
list[3:5] -> [3,4]  [start=inclusive:end=exclusive]

Slicing
list[3:]  [3,4,5]
list[:3]  [0,1,2]
print(list[1] + list[3])  4

list2 = [[1,2,3],[3,4,5],[6,7,8]]
x[2][:2]  [6,7]

Adding and removing elements
list_ext = list + [6,7]
del(list_ext[0]) #note: all indexes change immediatly after
list_ext[1]= “a” this call, so ‘1’ is now [0] and ‘2’ is [1]
 [1,a,3,4,5,6,7]

If you want to make a copy of list ‘list_copy’ and prevent that changes
in this list also affect ‘list’  list_copy = list(list)

Functions and packages for Python Lists
max(), min(), mean(), median(), len(), type()
round(number, ndigits) e.g. round(7.27,1)  7.3
complex([real[,imag]])
sorted(iterable, reverse = True)
 return a new sorted list from the items in iterable
(reverse=True, big -> small)
list.index(), list.count(), list.append(), list.remove(),
list.reverse()  reverses the order of the elements in the list
str.capitalize(), str.replace(), str.upper()
Numpy (Numeric Python)

,Import numpy as np
! Numpy arrays: contain only one type (int,floats, etc.)
! If you call: numpy_array + numpy_array it sums the firts element of
the first list with the first element of the second list
e.g. list = [1,2,3] ; np_array = np.array([1,2,3])
* list + list  [1,2,3,1,2,3]
* np_array + np_array  [2,4,6]

Numpy subsetting
np_array = np.array([1,2,3,4,5])
np_array > 2  array([False, False, True, True, True])
np_array[np_array>2]  array([3,4,5])

2D Numpy Arrays
Multiple rows/columns: np_2d.shape=4,2 means 4 rows w/ 2 elements each

np_2d[0][2] or np_2d[0,2] selects the third element of the first row
np_2d[:,1:3] selects the second and third element of every row
np_2d[1,:] selects only the entire second row

Basic statistics
np.mean(np_array)
np.median(np_array)
np.std(np_array)
np.corrcoef(np_array)

set an index to a np_array:
e.g. np_positions[‘GK’, ‘M’, ‘A’]
np_heights[191,184,185,…,179]

* gk_heights = np_heights[np_positions == ‘GK’]
This call prints the heights of the goalkeepers (GK)

* gk_heights = np_heights[np_positions != ‘GK’]
This call prints the heights of all other players then GK

, Intermediate Python

Matplotlib
Import matplotlib.pyplot as plt

plt.plot(x,y) ; plt.scatter()
plt.show()

put the x-axis on a log scale: plt.xscale(‘log’)

Histogram

plt.hist(x, bins=#, range=None, normed=False/True, weights=None)
plt.show()

plt.clf(): cleans up so that you can start fresh -> after plt.show()

Customization

plt.xlabel(‘’)
plt.ylabel(‘’)
plt.title(‘’)
plt.yticks([0,2,4])
plt.xticks([])

Add more data: y = [ , , ] + y ; x = [ , , ] + x

plt.scatter(x,y, s= np.array(), c = list, alpha = )
s = size (array)
c = colour (list/array)
alpha = transparancy

plt.grid(True)  gridlines are shown in the plot

Dictionaries in Python

create a dictionary: dict = { ‘’:{‘’: ,‘’: ,‘’:} }
data sorted in alphabetical order
if data belongs together europe = {’spain’:’madrid’, ‘france’:’paris’}
add data to dictionary: europe[‘italy’] = ‘rome’
dict[‘key’] = ‘value’  {‘key’:’value’}
check if it’s added: print(‘italy’in europe)-> True
delete: del(europe[‘australia’])

Dictionary of dictionaries:
europe = {‘spain’:{‘cap’:’madrid’,’pop’:46.77}, ‘france’:
{‘cap’:’paris’,’pop’:66.03}}

Create sub-dict data: (1) data = {‘capital’:’rome’, ‘population’:59,85}
(2) europe[‘italy’] = data

Select elements: europe[‘spain’][‘pop’]  46.77

Voordelen van het kopen van samenvattingen bij Stuvia op een rij:

Verzekerd van kwaliteit door reviews

Verzekerd van kwaliteit door reviews

Stuvia-klanten hebben meer dan 700.000 samenvattingen beoordeeld. Zo weet je zeker dat je de beste documenten koopt!

Snel en makkelijk kopen

Snel en makkelijk kopen

Je betaalt supersnel en eenmalig met iDeal, creditcard of Stuvia-tegoed voor de samenvatting. Zonder lidmaatschap.

Focus op de essentie

Focus op de essentie

Samenvattingen worden geschreven voor en door anderen. Daarom zijn de samenvattingen altijd betrouwbaar en actueel. Zo kom je snel tot de kern!

Veelgestelde vragen

Wat krijg ik als ik dit document koop?

Je krijgt een PDF, die direct beschikbaar is na je aankoop. Het gekochte document is altijd, overal en oneindig toegankelijk via je profiel.

Tevredenheidsgarantie: hoe werkt dat?

Onze tevredenheidsgarantie zorgt ervoor dat je altijd een studiedocument vindt dat goed bij je past. Je vult een formulier in en onze klantenservice regelt de rest.

Van wie koop ik deze samenvatting?

Stuvia is een marktplaats, je koop dit document dus niet van ons, maar van verkoper lisaholling1. Stuvia faciliteert de betaling aan de verkoper.

Zit ik meteen vast aan een abonnement?

Nee, je koopt alleen deze samenvatting voor €3,39. Je zit daarna nergens aan vast.

Is Stuvia te vertrouwen?

4,6 sterren op Google & Trustpilot (+1000 reviews)

Afgelopen 30 dagen zijn er 61231 samenvattingen verkocht

Opgericht in 2010, al 15 jaar dé plek om samenvattingen te kopen

Start met verkopen
€3,39  3x  verkocht
  • (0)
In winkelwagen
Toegevoegd