Shapiro wilk test - Samenvattingen, Aantekeningen en Examens
Op zoek naar een samenvatting over Shapiro wilk test? Op deze pagina vind je 42 samenvattingen over Shapiro wilk test.
Pagina 4 van de 42 resultaten
Sorteer op
-
Grand Canyon University - HLT 362V HLTV Exercise 18 & 33 Graded A
- Tentamen (uitwerkingen) • 5 pagina's • 2022
-
Ook in voordeelbundel
-
- €9,38
- + meer info
1. Mayland et al. (2014) do not provide the degrees of freedom ( df ) in their study. Use the degrees of freedom formulas provided at the beginning of this exercise to calculate the group df and the error df . The degrees of freedom are calculated by subtracting k, the number of groups in the study (which is 3) by the number N of participants. 255 – 3. df = 252. The error df is done by the formula k – 1, so 3 – 1 = 2. The error df is 2 2. What is the F value and p value for spiritual...
-
CWP test with 100% correct answers 2024
- Tentamen (uitwerkingen) • 17 pagina's • 2024
-
- €7,90
- + meer info
I am using x to predict y. When I know the value of x, the mean-squared-error of my estimate of y is less than when I don't know x. - answer-x explains some of the variance in y If the SSmodel is greater than the SSresidual... - answer-the model accounts for more than 50% of the total variance What is the coefficient of determination? - answer-The proportion of variance accounted for in the dependent variable by the predictor variables. What is the relationship between r and beta in a ...

-
PSY 7864-PSY7864 Week 6 Assignment_T-Test Application
- Tentamen (uitwerkingen) • 12 pagina's • 2021
-
- €8,89
- + meer info
PSY 7864-PSY7864 Week 6 Assignment_T-Test Application Running head: T-TEST DATA ANALYSIS AND APPLICATION For this assignment, the data file ‘’ was utilized to measure the difference between two data populations and their corresponding means. The two variables applied are gender and GPA. The analysis and application of the t-test seek to determine if there is a significant difference between the means of these two variables: gender and GPA. To effectively utilize the t-test, this pap...

-
PSY 7864-PSY7864 Unit 8 Assignment 1
- Tentamen (uitwerkingen) • 10 pagina's • 2021
-
- €8,40
- + meer info
PSY 7864-PSY7864 Unit 8 Assignment 1 INDEPENDENT T TEST 2 Independent t Test Within statistics there are multiple resources in which are used to better understand the data given. Some of these resources include, histograms, descriptive statistics, Shapiro-Wilk test, and the Levene test. Each different data collector is used in order to provide statistical data in different forms in order to see different aspects. Seeing each form in different aspects allows for more data to be recorded ...
-
HLT 362V Module 3 Exercises 31 And 32
- Tentamen (uitwerkingen) • 8 pagina's • 2022
-
- €7,90
- + meer info
HLT 362V Module 3 Exercises 31 And 32. Do the example data meet the assumptions for the independent samples t -test? Provide a rationale for your answer. Yes, the data meet the assumptions for the independent samples t-test because the sample population is within standard distribution, there is equal variances between the two samples and the observations are independent. 2. If calculating by hand, draw the frequency distributions of the dependent variable, wages earned. What is the shap...
-
HLT 362 V Statistics Module 4 Exercise 33 Complete Solution
- Tentamen (uitwerkingen) • 8 pagina's • 2021
-
- €13,75
- + meer info
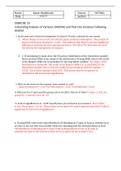
HLT362v Date 1/14/17 Section EXERCISE 33 Calculating Analysis of Variance (ANOVA) and Post Hoc Analyses Following ANOVA 1. Do the data meet criteria for homogeneity of variance? Provide a rationale for your answer. When doing a Leven’s test, you test the equal variances assumption. The p value of hours worked post treatment = 0.455. This indicate that there is not any significant differences between the three groups variances. Therefore the data does not meet the criteria for h...
-
HLT 362 V Statistics Module 5 Exercise 29 and 35 (90points)
- Tentamen (uitwerkingen) • 4 pagina's • 2021
-
- €13,15
- + meer info
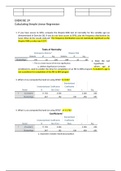
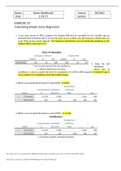
EXERCISE 29 Calculating Simple Linear Regression 1. If you have access to SPSS, compute the Shapiro-Wilk test of normality for the variable age (as demonstrated in Exercise 26). If you do not have access to SPSS, plot the frequency distributions by hand. What do the results indicate? The frequency distribution was not statistically significant as the Shapiro-Wilk p value was 0.357. Tests of Normality Kolmogorov-Smirnova Shapiro-Wilk Statistic df Sig. Statistic df Sig. StudentAge ...
-
HLT362V - Module 4 Exercise 33. Questions And Answers. 100% Correct
- Tentamen (uitwerkingen) • 8 pagina's • 2021
-
- €9,38
- + meer info
Name Karen Westbrook Course HLT362v Date 1/14/17 Section EXERCISE 33 Calculating Analysis of Variance (ANOVA) and Post Hoc Analyses Following ANOVA 1. Do the data meet criteria for homogeneity of variance? Provide a rationale for your answer. 1. When doing a Leven’s test, you test the equal variances assumption. The p value of hours worked post treatment = 0.455. This indicate that there is not any significant differences between the three groups variances. Theref...

-
HLT 362VModule 4 Ex33
- Tentamen (uitwerkingen) • 8 pagina's • 2022
-
Ook in voordeelbundel
-
- €9,38
- + meer info
Calculating Analysis of Variance (ANOVA) and Post Hoc Analyses Following ANOVA 1. Do the data meet criteria for homogeneity of variance? Provide a rationale for your answer. 1. When doing a Leven’s test, you test the equal variances assumption. The p value of hours worked post treatment = 0.455. This indicate that there is not any significant differences between the three groups variances. Therefore the data does not meet the criteria for homogeneity of variance. 2. 2. If calculating by...
-
Grand Canyon UniversityHLT 362VModule 5 Ex 29and35 (90points)
- Tentamen (uitwerkingen) • 4 pagina's • 2022
-
Ook in voordeelbundel
-
- €8,40
- + meer info
1. If you have access to SPSS, compute the Shapiro-Wilk test of normality for the variable age (as demonstrated in Exercise 26). If you do not have access to SPSS, plot the frequency distributions by hand. What do the results indicate? The frequency distribution was not statistically significant as the Shapiro-Wilk p value was 0.357.

Studiestress? Voor verkopers op Stuvia zijn dit juist gouden tijden. KA-CHING! Verdien ook aan je samenvattingen en begin nu met uploaden. Ontdek alles over verdienen op Stuvia


