MIP2602 Assignment 4
2024 (695941)- DUE
13 August 2024
[Company address]
,MIP2602 Assignment 4 2024 (695941)- DUE 13 August 2024
Question 1
1.1 Read the scenario below and answer the questions that follow: Mrs Mbeki
conducted a survey to find out how many coins the learners in Grade 5 at
IMMACULATE CONVENT school had on them (in their pockets or purses). Mrs Mbeki
randomly surveyed 40 Grade 5 learners at IMMACULATE CONVENT school. She
obtained the following data: 4 6 3 6 7 2 3 3 2 0 0 5 5 4 8 2 0 0 2 1 0 0 0 4 3 5 0 2 3 6 0 5
54820021
1.1.1 What is the random variable of interest in this scenario? (1)
1.1.2 What is the population of interest in this scenario? (1)
1.1.3 What is the sample of interest in this scenario? (1)
1.1.4 Explain the nature of data that was collected in this scenario. In your explanation
state whether it is qualitative or quantitative data. Further state whether it is categorical
data or numerical data. If the data is numeric, state whether it is discrete or continuous.
(3)
1.1.5 Which graph(s) can best display this type of data? Explain your answer. (2)
1.2 The Curriculum and Assessment Policy Statement (CAPS) requires Grade 6
learners to be able to “draw a variety of graphs including pictographs (many-to-one
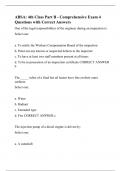
correspondence) to display and interpret data”. Use figure 1 to answer the questions
that follow. 4 Figure 1: Cellphones sold in Prayash’s shop
, 1.2.1 Use figure 1 to answer the following questions:
1.2.1.1 Write down the points that you will use to explain to grade 6 learners what a
pictograph is. (2)
1.2.1.2 Draw a pictograph (many-to-one correspondence) to demonstrate what a
pictograph looks like. Use =2; = 2; =2; = 2 to represent the data in figure 1. (9)
1.2.2 Which other graph can best represent the data in figure 1? Explain your answer.
(2) \
1.2.3 Use Microsoft Excel to draw the graph you have mentioned in 1.2.2 using the data
in figure 1. (7)
1.2.4 Design (ask) two questions that will help Grade 6 learners interpret the data
displayed in figure 1 and the graph you drew for question 1.2.1.2. 1.2.4.1
____________________________________________. (1)
1.2.4.2 ____________________________________________. (1) [30]
Question 1.1
1. 1.1.1 What is the random variable of interest in this scenario? (1)
o The random variable of interest is the number of coins that Grade 5
learners at IMMACULATE CONVENT school have in their pockets or
purses.
2. 1.1.2 What is the population of interest in this scenario? (1)
2024 (695941)- DUE
13 August 2024
[Company address]
,MIP2602 Assignment 4 2024 (695941)- DUE 13 August 2024
Question 1
1.1 Read the scenario below and answer the questions that follow: Mrs Mbeki
conducted a survey to find out how many coins the learners in Grade 5 at
IMMACULATE CONVENT school had on them (in their pockets or purses). Mrs Mbeki
randomly surveyed 40 Grade 5 learners at IMMACULATE CONVENT school. She
obtained the following data: 4 6 3 6 7 2 3 3 2 0 0 5 5 4 8 2 0 0 2 1 0 0 0 4 3 5 0 2 3 6 0 5
54820021
1.1.1 What is the random variable of interest in this scenario? (1)
1.1.2 What is the population of interest in this scenario? (1)
1.1.3 What is the sample of interest in this scenario? (1)
1.1.4 Explain the nature of data that was collected in this scenario. In your explanation
state whether it is qualitative or quantitative data. Further state whether it is categorical
data or numerical data. If the data is numeric, state whether it is discrete or continuous.
(3)
1.1.5 Which graph(s) can best display this type of data? Explain your answer. (2)
1.2 The Curriculum and Assessment Policy Statement (CAPS) requires Grade 6
learners to be able to “draw a variety of graphs including pictographs (many-to-one
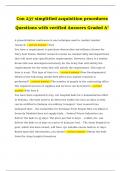
correspondence) to display and interpret data”. Use figure 1 to answer the questions
that follow. 4 Figure 1: Cellphones sold in Prayash’s shop
, 1.2.1 Use figure 1 to answer the following questions:
1.2.1.1 Write down the points that you will use to explain to grade 6 learners what a
pictograph is. (2)
1.2.1.2 Draw a pictograph (many-to-one correspondence) to demonstrate what a
pictograph looks like. Use =2; = 2; =2; = 2 to represent the data in figure 1. (9)
1.2.2 Which other graph can best represent the data in figure 1? Explain your answer.
(2) \
1.2.3 Use Microsoft Excel to draw the graph you have mentioned in 1.2.2 using the data
in figure 1. (7)
1.2.4 Design (ask) two questions that will help Grade 6 learners interpret the data
displayed in figure 1 and the graph you drew for question 1.2.1.2. 1.2.4.1
____________________________________________. (1)
1.2.4.2 ____________________________________________. (1) [30]
Question 1.1
1. 1.1.1 What is the random variable of interest in this scenario? (1)
o The random variable of interest is the number of coins that Grade 5
learners at IMMACULATE CONVENT school have in their pockets or
purses.
2. 1.1.2 What is the population of interest in this scenario? (1)