Observations, variables and data matrices
Statistics is the science concerned with developing and studying methods for collecting, analyzing, interpreting and
presenting empirical data. Statistics tries to answer uncertain questions and uses numerical evidence to draw valid
conclusions.
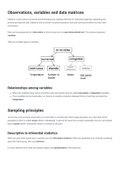
Data can be represented as a data matrix, in which every row is a case/observational unit. The columns represent
variables.
There are multiple types of variables:
Relationships among variables
When two variables show some connection with one another, they are called associated (or dependent) variables.
If two variables are not associated, i.e. there is no evident connection between the two, then they are said to be
independent.
Sampling principles
To have the most accurate observation, you would like to including the whole target population (e.g. the whole Dutch
population), which is called census (Dutch: volkstelling). In almost all cases this is nearly impossible, thus you will instead
take a sample (Dutch: steekproef) which is a subset of all cases.
Descriptive to inferential statistics
When you get results based upon a sample, you have descriptive statistics. When you generalize and conclude something
about the whole group, that is an inference.
For your inference to be valid, the sample needs to be representative of the entire pot.
, Obtaining Good Samples
Almost all statistical methods are based on the notion of implied randomness. Most commonly used random sampling
techniques are simple, stratified and cluster sampling.
Simple Random Sample: Randomly select cases from the population, where there is no implied connection between
points that are selected.
Stratified Sample: Strata are made up of similar observations. We take a simple random sample from each stratum
(e.g. sex, income level).
Cluster Sample: Clusters are usually not very different from one another. We take a simple random sample of
clusters, and then sample all observations in that cluster. Clusters can be provinces, cities, schools etc.
Multistage sample: Like cluster sample, but instead of keeping all observations in each cluster, we collect a
random sample within each selected cluster.
Sampling bias
If a sample is biased, that means it is not representative: the sample will not yield an accurate prediction. May have
different causes:
Non-response: If only a small fraction of the randomly sample people choose to respond to a survey.
Voluntary response: Occurs when the sample consists of people who volunteer to respond because they have strong
opinions on the issue.
Convenience sample: Individuals who are easily accessible are more likely to be included in the sample.
Large samples are preferable, but even when the sample size is huge, if the sample is biased, the sample will not yield an
accurate prediction.
Observational studies vs. experiments
Researchers perform an observational study when they collect data in a way that does not directly interfere with how the
data arise. They can provide evidence of a naturally occurring association between variables, but they cannot by
themselves show a causal connection as association does not imply causation.
To investigate the possibility of a causal connection, researchers conduct an experiment. Experiments use assignment of
treatment. Usually there will both be an explanatory and response variable. When the assignment includes randomization,
e.g. using a coin flip, it is called a randomized experiment.
Principles of experimental design
Randomized experiments are generally built on four principles:
Control: Researchers assign treatments to cases, and they do their best to control any other differences in the
groups.
Randomize: Randomly assign subjects to treatments, and randomly sample from the populations whenever possible,
because of variables that cannot be controlled.
Replicate: The more cases observed, the more accurately an estimation of the effect of the explanatory variable on


