100% tevredenheidsgarantie Direct beschikbaar na betaling Zowel online als in PDF Je zit nergens aan vast
logo-home
Summary Macroeconomics for EOR €4,39
In winkelwagen

Samenvatting

Summary Macroeconomics for EOR

 25 keer bekeken  1 keer verkocht

This is a summary of Macroeconomics for EOR students. This summary covers the essentials of chapters 1 till 15, but excluding chapter 12. It has a couple references to the book itself (only useful if needing more examples), but without the book the summary will be enough. It covers the definitions...

[Meer zien]
Voorbeeld 2 van de 10  pagina's

  • Nee
  • H1-15 (exclusief h12)
  • 23 september 2021
  • 10
  • 2020/2021
  • Samenvatting
book image

Titel boek:

Auteur(s):

  • Uitgave:
  • ISBN:
  • Druk:
Alles voor dit studieboek (2)
Alle documenten voor dit vak (2)
avatar-seller
Bramdejong01
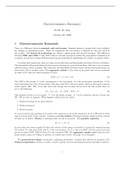
Macroeconomics Summary
B.J.H. De Jong
October 29, 2020


1 Macroeconomics Essentials
There is a difference between nominal- and real income. Nominal income is income that is not adjusted
for changes in purchasing power. While in comparison the real income is adjusted by the price level in
the country. The factors of production are: labour, capital goods and natural resources. The difference
between GDP and GNP is that GDP refers to incomes generated within the geographical boundaries of
a country, no matter by whom.GNP measures income generated by inhabitants of a country, no matter where.

A circular flow means that there are some sectors like firms and households and those will stay in balance.
The households will provide labour for the firms in exchange for goods of those firms. But that is in a economy
without money, barter economy. But otherwise the households will also receive income and spend money on
those firms, this is another circle. The aggregate output, is the value of all goods and services produced
by firms. If we take the whole equation we have:

GDP = C + I + G + N X (1)

The GDP is the income, C is the consumption, I the investment, G is the government expenditure, T the
taxes (introduced in a bit), S the savings (also later) and NX is the net exports which is also equal to export
minus import (EX - IM). If we take taxes and savings into account and we have the full circular flow, we
get to the following:
(T − G) + (S − I) + (IM − EX) = 0 (2)
This equation needs to be in balance. T - G is the public savings . S - I is the domestics private savings and
IM - EX are the net imports. What happens when taxes are raised:

1. Reduced savings by an equal amount
2. Reduced imports
3. Raised exports
we can see that in the equation if we rewrite the equation to one of the exponents to the LHS and see what
sign is in front of the Taxes variable. Countries run twin deficits if both government budget and the current
account are in deficit. Money is anything sellers accept as payment. The quantity equation:

M ×V =P ×Y (3)

It states that the money supply M times the velocity of the money circulation V equals the nominal income
PY (where P is the price level and Y is the real income). So Y is the real GDP, add the price level and
get the nominal GDP. AND M times V is also nominal GDP. The aggregate supply curve indicates how
much output, firms are willing to produce at various price levels. (At page 18 an example).

The government budget is primarily a planning instrument. It shows how deficits are financed. The
balance of payments records a country’s trade in goods, services and financial assets with other countries.


1

, The government has a second option, it can also be in dept to the central bank. So we denote government
debt owed to the private sector by BP S and debt owed by the central bank by BCB . Then we have:
G − T = ∆BP S + ∆BCB (4)
The balance of payments is subdivided in three accounts: the current account CA, the capital account CP
and the official reserve account OR:
CA + CP + OR = 0 (5)
The current account records the flow of goods and services across borders. We simply say: CA = EX -
IM. The capital account records all purchases and sales of foreign assets that is of such things as bonds,
stocks or securities, that do not involve the central bank. If foreign assets are denoted by F, then: CP =
−∆F . The official reserve account tracks the involvement of the central bank in the foreign exchange
market. If RES denotes central bank foreign currency reserves then: OR = −∆RES. (on page 20 there are
examples with these). And using the definitions here we get:
EX − IM = ∆F + ∆RES (6)
is also the balance of payments definition. We also have equality M = BCB + RES. So the two ways to
increase the money supply are to buy either government bonds or foreign exchange:
∆M = ∆BCB + ∆RES (7)
if e.g. the central bank buys foreign currency, be it to finance a current account surplus, RES rises and
the money supply M rises as well.

A model is a simplified, logically coherent story that links economic variables like consumption and taxes
to each other. Empirical tests are confrontations of hypotheses derived from models with real-world data.
They serve to gauge whether a model is useful or not.


2 Booms and Recessions (I): the Keynesian Cross
A steady-state income results when all variables including capital stock, have adjusted to their equilibrium
levels. The potential income is income that can be produced with current labour and capital. The capital
stock may or may not have reached its equilibrium level.

The business cycle refers to recurring fluctuation of income relative to potential income. A boom
describes rising income and a recession describes declining income. The production function is a math-
ematical formula showing how the use of labour and machinery generate output. We assume that AS-curve
(aggregate supply) is horizontal in short-run. In the long-run it will be vertical.
The variable I stands for planned investment. The variable I u stands for unplanned investment. The
sum of all planned demand is called aggregate expenditure. For contrast we call the sum of all demand,
planned and unplanned, actual expenditure. If we talk about taxes T, we mean net taxes that is, gross
taxes minus transfers. And G only represents government purchases of goods and services.

The marginal propensity to consume says by how much consumption rises if income rises by one
unit. It is given by the consumption function:
C = cY (1)
substitute this into the standard equation, we get:
AE = cY + I + G + N X (2)
The Keynesian cross is a diagram which plots planned expenditure against income Y and actual expen-
diture AE. In the equilibrium Y = AE. The expression for the equilibrium income obtained from page
49:
1
Y = (I + G + N X) (3)
1−c

2

Voordelen van het kopen van samenvattingen bij Stuvia op een rij:

Verzekerd van kwaliteit door reviews

Verzekerd van kwaliteit door reviews

Stuvia-klanten hebben meer dan 700.000 samenvattingen beoordeeld. Zo weet je zeker dat je de beste documenten koopt!

Snel en makkelijk kopen

Snel en makkelijk kopen

Je betaalt supersnel en eenmalig met iDeal, creditcard of Stuvia-tegoed voor de samenvatting. Zonder lidmaatschap.

Focus op de essentie

Focus op de essentie

Samenvattingen worden geschreven voor en door anderen. Daarom zijn de samenvattingen altijd betrouwbaar en actueel. Zo kom je snel tot de kern!

Veelgestelde vragen

Wat krijg ik als ik dit document koop?

Je krijgt een PDF, die direct beschikbaar is na je aankoop. Het gekochte document is altijd, overal en oneindig toegankelijk via je profiel.

Tevredenheidsgarantie: hoe werkt dat?

Onze tevredenheidsgarantie zorgt ervoor dat je altijd een studiedocument vindt dat goed bij je past. Je vult een formulier in en onze klantenservice regelt de rest.

Van wie koop ik deze samenvatting?

Stuvia is een marktplaats, je koop dit document dus niet van ons, maar van verkoper Bramdejong01. Stuvia faciliteert de betaling aan de verkoper.

Zit ik meteen vast aan een abonnement?

Nee, je koopt alleen deze samenvatting voor €4,39. Je zit daarna nergens aan vast.

Is Stuvia te vertrouwen?

4,6 sterren op Google & Trustpilot (+1000 reviews)

Afgelopen 30 dagen zijn er 49497 samenvattingen verkocht

Opgericht in 2010, al 14 jaar dé plek om samenvattingen te kopen

Start met verkopen
€4,39  1x  verkocht
  • (0)
In winkelwagen
Toegevoegd