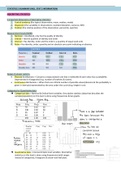
This is an English summary of the information for statistics 3 for the clinical track (statistiek 3 voor de klinische leerlijn). Statistics 2 is also repeated. The summary explains each test one by one in a logical order. I also included extra explanations on topics I thought were a bit vague in th...
3 important dimensions of descriptive statistics:
1. Central tendency (the typical observation; mean, median, mode)
2. Dispersion (the variability in observations; standard deviation, variance, IQR)
3. Position (the relative position of the observation; percentile, quartile)
Measurement levels (NOIR)
1. Nominal = Unordered, only has the quality of identity
2. Ordinal = Has the qualities of identity and order
3. Interval = Has identity, order and the order is a quantity of equal sized units
4. Ratio = Has identity, order, quantity and an absolute zero point indicating an absence
Range of answer options
Discrete distributions = Concerns a measurement unit that is indivisible & each value has a probability
(represented in histograms) (e.g. number of brothers & sisters)
Continuous distributions = When there are infinite number of possible values/divisions & the probability is
given in intervals (represented by the area under the curve) (e.g. height in cm)
Categorical vs Quantitative data
Categorical data = Nominal & Ordinal level variables. Descriptive statistics (data that describes the
sample/population) on this level is done using frequencies & bar graphs.
Quantitative data = Interval & Ratio level variables. Descriptive
statistics on this level is done using frequencies (with ranges
instead of categories), histograms & steam-and-leaf plots.
,INFERENTIAL STATISTICS
Data observations (validity & reliability)
The quality of an estimator (e.g. a mean) is expressed by:
o Reliability (efficiency/precision)
o Validity
(representativeness/unbiasedness)
The empirical rule
The standard deviation is part of
the normal distribution of a
population. There are empirical
rules that state how much
percent of the population falls
within 1 (66%), 2 (95%) or 3
(99%) standard deviations.
Central tendency (Mean, median, mode),
skew & graph shapes
Mean = the average
Median = the middle number
Mode = the most frequent number
,Dispersion: From deviation/variance to standard deviation
Normal distributions work with data variability. There are different ways to show data variability and each
can be transformed into the next up to the standard deviation.
1. Range = The difference between the minimum and maximum variable
2. Deviation = The difference from the mean for each single item
3. Sum of Squares = The total deviance from the mean (so all items together).
a. You first square the deviation score for each single item (to eliminate negatives)
b. Next you sum these all up to show the total deviance
4. Variance = The standardized sum of squares
5. Standard Deviations = The average deviation from the mean (through cancelling out the square)
Central tendency & Dispersion: Data distributions (population, sample, sampling)
Different data can belong to different distributions. There are 3 types:
1. Population parameters = concerns the distribution of the entire population, often unknown
2. Sample statistics = concerns the distribution of one sample representative of the population
3. Sampling statistics = concerns the distribution of several samples & follows central limit theorem = If you
take sufficiently large samples from the population with replacement, then the sampling distribution of
, sample means will increasingly approximate a normal distribution and the sampling mean will approach the
population mean
Measures of position: Box-plot
A box-plot divides the data up in four equal parts called quartiles
Measures of position: Percentiles
Shows the percentage of the population/sample that scores
lower than the observed position. But, note that the difference
in raw scores in not representative of the difference in
percentile scores: It is a non-linear transformation
Measures of position: Z & T scores
Both standardize the observed score in re
from the mean
Z-scores are for when you know the standard deviation of the population
T- -distributions
therefore have thicker tails which allow for more uncertainty. The resemblance of the T-distribution to the
Z-distribution depends on the degrees of freedom (more df = less thick tails)
o Degrees of freedom = n the nr of restrictions (n = sample size)
o Degrees of freedom depend on the restrictions on the observations:
One df disappears for each restriction, often this is at least 1 for the fact that you are
estimating the mean
As n (sample size) increases, the graph will resemble a normal distribution more
Voordelen van het kopen van samenvattingen bij Stuvia op een rij:
Verzekerd van kwaliteit door reviews
Stuvia-klanten hebben meer dan 700.000 samenvattingen beoordeeld. Zo weet je zeker dat je de beste documenten koopt!
Snel en makkelijk kopen
Je betaalt supersnel en eenmalig met iDeal, creditcard of Stuvia-tegoed voor de samenvatting. Zonder lidmaatschap.
Focus op de essentie
Samenvattingen worden geschreven voor en door anderen. Daarom zijn de samenvattingen altijd betrouwbaar en actueel. Zo kom je snel tot de kern!
Veelgestelde vragen
Wat krijg ik als ik dit document koop?
Je krijgt een PDF, die direct beschikbaar is na je aankoop. Het gekochte document is altijd, overal en oneindig toegankelijk via je profiel.
Tevredenheidsgarantie: hoe werkt dat?
Onze tevredenheidsgarantie zorgt ervoor dat je altijd een studiedocument vindt dat goed bij je past. Je vult een formulier in en onze klantenservice regelt de rest.
Van wie koop ik deze samenvatting?
Stuvia is een marktplaats, je koop dit document dus niet van ons, maar van verkoper FabienneDenberg. Stuvia faciliteert de betaling aan de verkoper.
Zit ik meteen vast aan een abonnement?
Nee, je koopt alleen deze samenvatting voor €8,99. Je zit daarna nergens aan vast.