Lecture 1 : Anova
Anova: Step by Step
• Step 1 | Defining the objectives
• Step 2 | Designing the study
• Step 3 | Checking assumptions
• Step 4 | Estimating the model and assessing fit
• Step 5 | Interpreting the results
• Step 6 | Validating the results
Step 1: Defining the objectives
´ Test whether treatments (categorical variables) lead to different levels for a (set of) metric outcome
variables, e.g.
o Does online ad design, in particular: position of picture and logo (discreet), affect the click-through
rate?
o How does visit frequency (once or twice a year) and use of samples (yes\no) affect physicians’
prescriptions?
o How does promo activity affect store sales and traffic?
ANOVA:
1. Looking for a causal relationship: we are looking for input variables that are driving an outcome.
2. Measurement scale: outcome variable to be metric (ratio or interval), input variables are discreet
categorical variables that are non-metric and can take on limited discreet set of values without being
ordered.
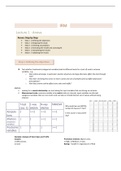
store coupon price cuts sales rating traffic
1 1 1 10 9 30
2 1 1 9 10 25
T-test 1-way N-way MANOVA 3
4
1
1
1
1
10
8
8
4
29
32
Why would we use ANOVA 5 1 1 9 6 33
(ind. S) ANOVA ANOVA
6 1 2 8 8 24
instead of classical T-Test? 7
8
1
1
2
2
8
7
4
10
28
20
9 1 2 9 6 40
#popula 2 >=2 >=2 >=2
10 1 2 6 9 18
11 1 3 5 8 15
In this course 1-way and N- 12
13
1
1
3
3
7
6
9
6
22
23
tions way! 14
15
16
1
1
2
3
3
1
4
5
8
10
4
10
10
22
25
#factors 1 1 >=1 >=1
17 2 1 9 6 41
18 2 1 7 8 23
19 2 1 7 4 36
20 2 1 6 9 20
(treatment 21
22
2
2
2
2
4
5
6
8
16
15
variables) 23
24
2
2
2
2
5
6
10
4
13
25
25 2 2 4 9 12
#outcome 1 1 1 >=1 26
27
28
2
2
2
3
3
3
2
3
2
4
6
10
8
8
5
variables 29
30
2
2
3
3
1
2
9
8
2
6
Example: Analysis of Store Sales and Traffic
Coupon: Promotion intensity (#price cuts):
1=20Euro/visit, 1=High, 2=Medium, 3=Low
2=none Rating= “wealth”in region(score:1à10)
, Defining Objectives: Example Analysis of Store sales and Traffic
Q1: Do Stores Sales increase with use of coupon? T-Test (independent samples: 1 set of stores that do
have a coupon and 1 set that do not have a coupon, so
treated with different levels)
Number of outcome variables = 1 (sales)
Number of factors = 1 (coupon variable)
Number of populations = 2 (different levels of coupons)
Q2: Do Store Sales increase with promo intensity (# 1-way ANOVA
price cuts=low, medium, high)?
Number of outcome variables = 1 (sales)
Number of factors = 1 (number of price cuts)
Number of populations = 3 (different levels of price
cuts)
Q3a: Do Store Sales increase with couponing and (N)2-way ANOVA
promo intensity?
Number of outcome variables = 1 (sales)
Number of factors = 2 (coupon and promo intensity)
Number of populations = 6 (different levels of coupons
and promo intensity (number of coupons levels x
(times) number of promo levels instore))
Q3b: What if we control for region wealth? 2-way ANCOVA
X (not part)
In question two some people would say we do not need Anova, we could run a series of T-Tests in the first test we
could compare stores with a low to those with medium price cuts, in the second we could compare medium to high,
the third with low and high. NOT GOOD APPROACH! à
Q1:
H0: No difference in sales in stores
with coupon or without coupon
H1: There is a difference in sales in
stores with coupon or without coupon
(p < a = significant)
Why use ANOVA and not multiple t-tests
If you would conduct one T-Test (as in coupon example), where you would use an alpha of 0.5, then the intuition/
interpretation. In such a test, because of your choice of alpha, the probability that you deicide based on your test
that there is a difference even if there isn’t any in reality would be 5% (alpha), and then the complement of that is
that the probability that you decide that there is no effect, when there is no effect in reality is 95%.
Three tests in a row.
´ 1 test, a=.05:
- Probability of decision=‘effect’ while there is none: .05
- Probability of decision=‘no effect’ while there is none: .95
´ 3 tests, a=.05 in each test:
- Probability of decision=‘no effect’ in each test, while there is none: (.95)3=.857 (times
because you want to happen the same time) (0.143 chance that one of those tests you
conclude that there is an effect even where there is none in reality)
- Probability of decision=‘effect’ in at least one of the three tests, while there is none:
(1-.857)=.143>.05!!!
´ Probability of erroneously finding effect increases with number of tests
- Multiple testing problem: increase number of tests, chances that you by accident find
something in one of those tests even when there is nothing to find will grow


