100% tevredenheidsgarantie Direct beschikbaar na betaling Zowel online als in PDF Je zit nergens aan vast
logo-home
Summary Linear Regression IRM €3,99
In winkelwagen

Samenvatting

Summary Linear Regression IRM

2 beoordelingen
 13 keer bekeken  0 keer verkocht

Summary of 11 pages for the course Introduction To Research In Marketing at UVT (.)

Voorbeeld 2 van de 11  pagina's

  • 7 september 2022
  • 11
  • 2021/2022
  • Samenvatting
Alle documenten voor dit vak (7)

2  beoordelingen

review-writer-avatar

Door: Ilseschaap1 • 2 jaar geleden

review-writer-avatar

Door: steve0416 • 2 jaar geleden

avatar-seller
Kaat123
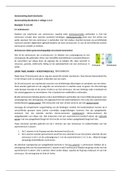
Lecture 2: Lineair Regression
Linear Regression: Step by Step
• Step 1 | Defining the objectives
• Step 2 | Designing the study
• Step 3 | Checking assumptions
• Step 4 | Estimating the model and assessing fit
• Step 5 | Interpreting the results
• Step 6 | Validating the results


Step 1: Defining the objectives
´ Examine the relationship between a metric dependent variable and one or more independent variables
(metric (interval, ratio), or non-metric (nominal, ordinal) -> dummies)
o Mars Pet Food: Does the market share of Frolic depend on the brand’s TV advertising budget and presence
in the retailers’ store flyer?
o Does a household’s online grocery spending depend on age, household size, and education level?
o Plopsaland De Panne: How are ticket sales affected by the ‘Ride to Happiness’ by Tomorrowland, and does
this impact depend on the weather?

Anova vs. Lineair regression
´ Linear regression is just like Anova a dependence method in which you look for a causal relationship
´ ANOVA: focus on non-metric independent variables (‘treatments’)
´ Linear regression: both non-metric and metric independent variables, and their possible interplay

Main difference:
- In Anova the focus is on non-metric explanatory variables, which we called treatments, they had
discrete alternative levels and we wanted to know about the impact of those variables
If variables that were continuous were included, they were mainly included as controls only
- In Linear Regression we are especially interest in the impact of metric independent variables as
well as non-metric ones and we may be looking at the interplay between te two


Step 2: Designing the study

´ Rows are respondents/ observations
´ Columns are the variables that we have information on

Which variables can be included?
´ Non-metric variables: nominal or ordinal -> create dummies (transform them) (use dummy coding)
´ Metric (continuous) variables: interval or ratio (and transformations of these variables, e.g., logarithmic,
power) à introduce them In their raw is also possible
´ And interactions of these variables:
• dummy and dummy
• continuous and dummy
• continuous and continuous

You can tell R that a variable is nominal or ordinal: R will automatically use one category as a benchmark, as a
reference group and then creates
dummy variables for the remaining
The linear regression model ones.

, ´ The simple linear regression model:
- Yi = b0+b1*X1i+ei
- examples:
o Satisfaction = b0+b1*child_dummyi+ei
->Does satisfaction depend on the presence of children? (Go to the orginal data file,
where number of children is, you could transform that, because you are interested in the
presence of children here into a zero and one à run a regression)
o Satisfaction = b0+b1*num.childi+ei
->Does satisfaction depend on the number of children? (Include number of children in your
analysis and then answer the question, depends on what you are expecting)

Y à Could be overall satisfaction of a consumer with the amusement park
X1 à Could be a variable of interest measured for a certain visitor Y
Than we could have a linear link between both, were B0 and B1 are the parameters to be estimated

What we have in a every regression model, that the link between the independent and the dependent variable will
never be perfect, either because:
1. Explanatory variables are missing you don’t have data on them
2. Measurement error in the dependent variable, so in all cases there will be an error term, that will remain
after accounting for the effect of your independent variables

´ The multiple linear regression model: include multiple explanatory variables at the same time
- Yi = b0+b1*X1i+b2*X2i +ei
- example:
o Satisfaction = b0+b1*child_dummyi+b2*waiti+ei
->Does satisfaction depend on the presence of children and on waiting time? (Take previous
model, but simply add a new coefficient times the value of the new variable)
Combination of a non-metric dummy variable and a continuous variable
o Satisfaction = b0+b1*num.childi+b2*waiti+ei
->Does satisfaction depend on the number of children and on waiting time? ()
Two continuous explanatory variables

!! You have an interaction when … !!
Always include the main effect, even if it does not matter or is not significant

´ The multiple linear regression model with interactions:
• Yi = b0+b1*X1i+b2*X2i+b3*X1i*X2i+ei
• example:
o Satisfaction = b0+b1*child_dummyi+b2*waiti+b3*waiti* child_dummyi+ei ->Does
satisfaction depend on the presence of children and on waiting time, and is the impact of
waiting time different for visitors with and without children? :logic could be that you
expect people with children to be much less lenient when it comes to waiting time, then
children become annoying)
o The third variables captures the interaction between the two
o If we allow for this interaction, what we want to allow for is that the effect of one
variable (waiting time) depends on the presence or the level of another variable (with or
without children)

Voordelen van het kopen van samenvattingen bij Stuvia op een rij:

Verzekerd van kwaliteit door reviews

Verzekerd van kwaliteit door reviews

Stuvia-klanten hebben meer dan 700.000 samenvattingen beoordeeld. Zo weet je zeker dat je de beste documenten koopt!

Snel en makkelijk kopen

Snel en makkelijk kopen

Je betaalt supersnel en eenmalig met iDeal, creditcard of Stuvia-tegoed voor de samenvatting. Zonder lidmaatschap.

Focus op de essentie

Focus op de essentie

Samenvattingen worden geschreven voor en door anderen. Daarom zijn de samenvattingen altijd betrouwbaar en actueel. Zo kom je snel tot de kern!

Veelgestelde vragen

Wat krijg ik als ik dit document koop?

Je krijgt een PDF, die direct beschikbaar is na je aankoop. Het gekochte document is altijd, overal en oneindig toegankelijk via je profiel.

Tevredenheidsgarantie: hoe werkt dat?

Onze tevredenheidsgarantie zorgt ervoor dat je altijd een studiedocument vindt dat goed bij je past. Je vult een formulier in en onze klantenservice regelt de rest.

Van wie koop ik deze samenvatting?

Stuvia is een marktplaats, je koop dit document dus niet van ons, maar van verkoper Kaat123. Stuvia faciliteert de betaling aan de verkoper.

Zit ik meteen vast aan een abonnement?

Nee, je koopt alleen deze samenvatting voor €3,99. Je zit daarna nergens aan vast.

Is Stuvia te vertrouwen?

4,6 sterren op Google & Trustpilot (+1000 reviews)

Afgelopen 30 dagen zijn er 53340 samenvattingen verkocht

Opgericht in 2010, al 14 jaar dé plek om samenvattingen te kopen

Start met verkopen
€3,99
  • (2)
In winkelwagen
Toegevoegd