100% tevredenheidsgarantie Direct beschikbaar na je betaling Lees online óf als PDF Geen vaste maandelijkse kosten
logo-home
Summary Beschrijvende Statistiek Hoorcollege 12 (H9.2&9.3) €2,99
In winkelwagen

Samenvatting

Summary Beschrijvende Statistiek Hoorcollege 12 (H9.2&9.3)

 0 keer verkocht

Dit is een samenvatting voor de leerstof van hoorcollege 12 van Beschrijvende Statistiek in de pre-master Orthopedagogiek aan de Universiteit van Amsterdam. Het behandelt hoofdstuk 9.2 en 9.3 van Statistics van Algresti & Franklin.

Voorbeeld 2 van de 5  pagina's

  • Nee
  • H9.2 & 9.3
  • 12 februari 2023
  • 5
  • 2022/2023
  • Samenvatting
book image

Titel boek:

Auteur(s):

  • Uitgave:
  • ISBN:
  • Druk:
Alle documenten voor dit vak (41)
avatar-seller
sevendeboer
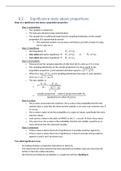
9.2. Significance tests about proportions
Steps of a significance test about a population proportion

- Step 1: assumptions
o The variable is categorical
o The data are obtained using randomization
o The sample size is sufficiently large that the sampling distribution of the sample
proportion ^p is approximately normal
 The expected numbers of successes and failures are both at least 15 using
the H0 value for p
- Step 2: hypotheses
o Null hypothesis  H 0 : p= p0
o One-sided alternative hypothesis  H a : p > p0 or H a : p < p0
o Two-sided alternative hypothesis  H a : p ≠ p0
- Step 3: test statistic
o Measures how far sample proportion ^p falls from the H0 value p0, if H0 is true.
o The sampling distribution of the sample proportion has mean equal to the
population proportion p and standard deviation equal to √ p (1− p)/ n
o When H0 is true, p= p 0, so the sampling distribution has mean p0 and standard
error se0 =√ p 0 (1− p0 )/n
o The test statistic is:
^p− p0 ^p −p 0
z= =


 se 0 p0 (1− p0)
n
sample proportion−value of proportion under H 0

standard error when H 0 is true
- Step 4: p-value
o The p-value summarizes the evidence. The p-value is the probability that the test
statistic takes a value like the observed test statistic or an even more extreme one, if
H0 is true.
o The p-value is taken to be the probability of a region of values, specifically the more
extreme values.
o Look up the z-value in the table at MINUS or do (1 – z-score)  that’s the p-value
o If H0 were true, the p-value is the probability that the test statistic would be as or
more extreme than the observed variable.
- Step 5: conclusion
o If the p-value is below the level of significance, it provides evidence against H 0.
o If the p-value is above the level of significance, it doesn’t provide strong evidence
against H0 and it can’t be thrown out.

Two-sided significance tests

- For testing whether a proportion falls above or below H 0
- The values that are more extreme than the observed test statistic value are ones that fall
farther in the tail in either direction.
- We find this by finding the probability in a single tail and then doubling it.

, The significance level tells us how strong the evidence must be

- The significance level is a number such that we reject H 0 if the P-value is less than or equal
to that number. In practice, the most common significance level is 0.05.

When we reject H0, we say the results are statistically significant.

“Do not reject H0” does not mean “accept H0”

- The population proportion has many plausible values besides the number in H 0.
- Even when insufficient evidence exists to reject H 0, it is improper to accept it and conclude
that p=p0.
- H0 contains a single possible value for the parameter, saying “do not reject H 0” emphasizes
that that value is merely one of many plausible ones.
- Saying “accept Ha is however permissible for the alternative hypothesis when that is the
conclusion of the test.

Deciding between a one-sided and two-sided test?

- In practice, two-sided is more common
- Guidelines in forming Ha:
o Consider the context of the real problem
o In most research articles, significance tests use two-sided p-values (most even)
o Confidence intervals are two-sided

The binominal test for small samples

- In practice, the large sample z-test performs well for two-sides alternatives, even for small
samples.
- Even when the sampling distribution is skewed, a tail probability that is smaller than the
normal probability in one tail, is compensated by a tail probability that is larger than the
normal probability in the other tail.
o Because of this, the p-value from the two-sided test using the normal table
approximates well a p-value from a small-sample test.

Dit zijn jouw voordelen als je samenvattingen koopt bij Stuvia:

Bewezen kwaliteit door reviews

Bewezen kwaliteit door reviews

Studenten hebben al meer dan 850.000 samenvattingen beoordeeld. Zo weet jij zeker dat je de beste keuze maakt!

In een paar klikken geregeld

In een paar klikken geregeld

Geen gedoe — betaal gewoon eenmalig met iDeal, creditcard of je Stuvia-tegoed en je bent klaar. Geen abonnement nodig.

Direct to-the-point

Direct to-the-point

Studenten maken samenvattingen voor studenten. Dat betekent: actuele inhoud waar jij écht wat aan hebt. Geen overbodige details!

Veelgestelde vragen

Wat krijg ik als ik dit document koop?

Je krijgt een PDF, die direct beschikbaar is na je aankoop. Het gekochte document is altijd, overal en oneindig toegankelijk via je profiel.

Tevredenheidsgarantie: hoe werkt dat?

Onze tevredenheidsgarantie zorgt ervoor dat je altijd een studiedocument vindt dat goed bij je past. Je vult een formulier in en onze klantenservice regelt de rest.

Van wie koop ik deze samenvatting?

Stuvia is een marktplaats, je koop dit document dus niet van ons, maar van verkoper sevendeboer. Stuvia faciliteert de betaling aan de verkoper.

Zit ik meteen vast aan een abonnement?

Nee, je koopt alleen deze samenvatting voor €2,99. Je zit daarna nergens aan vast.

Is Stuvia te vertrouwen?

4,6 sterren op Google & Trustpilot (+1000 reviews)

Afgelopen 30 dagen zijn er 69052 samenvattingen verkocht

Opgericht in 2010, al 15 jaar dé plek om samenvattingen te kopen

Begin nu gratis
€2,99
  • (0)
In winkelwagen
Toegevoegd