100% tevredenheidsgarantie Direct beschikbaar na betaling Zowel online als in PDF Je zit nergens aan vast
logo-home
College aantekeningen Toegepaste onderzoeksmethoden: Ontwikkeling & Mentale Gezondheid (SOW-PSB3RS45E) €5,49
In winkelwagen

College aantekeningen

College aantekeningen Toegepaste onderzoeksmethoden: Ontwikkeling & Mentale Gezondheid (SOW-PSB3RS45E)

 11 keer bekeken  0 keer verkocht

College aantekeningen van het vak Toegepaste onderzoeksmethoden: Ontwikkeling & Mentale Gezondheid (SOW-PSB3RS45E), oftewel Applied Research Methods DH, in het Engels, geschreven tijdens collegejaar 2022/2023

Voorbeeld 4 van de 46  pagina's

  • 25 februari 2023
  • 46
  • 2022/2023
  • College aantekeningen
  • Mike rinck
  • Alle colleges
Alle documenten voor dit vak (3)
avatar-seller
lottemeulink1
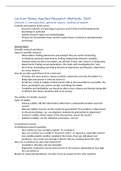
Lecture Notes Applied Research Methods: D&H
Lecture 1: introduction, general topics, statistical power
Contents and purpose of the course
- Research methods of psychology in general, and of clinical and developmental
psychology in particular
- Specific research topics and methodologies
- Prepare for the bachelor thesis and the master thesis in clinical or developmental
psychology

General topics
Scientific research and theory
Types of scientific research
- Observations: finding phenomena and seeing if they are worth researching
- Correlations and quasi-experiments: finding relationships between variables,
however when we find a correlation, we still don’t know ‘why’ there is a relationship
- Experiments: finding causal explanations, this helps with investigating the ‘why’
- All of them: developing and testing theories of experience and behavior, often there
are many theories
How do you tell a good theory from a bad one?
- Precision, the more precise a theory predicts a phenome correctly, the better it is.
Being right and precise is what we strive for
- Parsimony, trying to explain a phenomenon with as few assumptions as possible, the
fewer assumptions you need to predict something, the better
- Testability and falsifiability, we should be able to test a theory and thereby being able
to falsify it (the theory should be able to be wrong)

The validity of scientific research
Types of validity
- Internal validity: did the intervention rather than a confounded variable cause the
results?
- External validity: how far can the results be generalized? This problem is often found
in clinical psychology, e.g., can dysphoric students be generalized to depression?
- Construct validity: which aspect of the intervention caused the results?
- Statistical validity: are the statistical conclusions, correct?

Correlational research
Correlational research questions
- How closely are two variables related?  correlation
- How can I predict one variable if I know the other?  regression, especially useful if
one variable predicts another variable in the future, then you talk about real
prediction, very useful even though it doesn’t tell you anything about the ‘why’
How can correlations be used and interpreted?
- Correlation: direction and size (strength)
- Regression: prediction (can be more precise or less precise, depending on how high
the correlation is)
Beware of causal interpretations! You don’t have an answer for the ‘why’ question

,Correlation and causality problem
An example of the causality problem: depressed patients think more negatively about
themselves than others  correlation of depression and thinking, but how do they influence
each other?
- Negative thinking causes depression?
- Depression causes negative thinking?
- Depression and negative thinking cause each other? (Vicious circle)
- A third variable (genetic, neurological) causes both depression and negative thinking?
All explanations are possible, even though one may seem more possible, you can’t tell which
relationship is correct. More examples of dubious causalities: the number of crimes and the
number of churches in a city are correlated  Does religion cause crime? Sales of ice cream
and drowning rates are correlated  does ice cream cause drowning? Shoe size is positively
correlated with alcoholism, and negatively correlated with anxiety  do big feet cause
alcoholism, but protect from anxiety?

Correlation and causality
The relation is not symmetric
- If causality, then correlation
- But not: if correlation, then causality
And temporal order does not prove causality, either
- If A is the cause of B, A must happen before B
- But not: if A happens before B, A is the cause of B, causes must happen before
consequences, but it can disprove causality, what happened later cannot be the
cause of what happened later
 Even if two variables are both correlated and temporally ordered, the earlier one does
not have to be the cause of the later one!
 Correlation is a necessary, but not a sufficient precondition for causation!
The one and only way to establish a causal relationship underlying a correlation is by
conducting an experiment

Variables in experiments
Independent variables (manipulated by experimenter):
- What is a good independent variable? This is depended by you as experimenter, must
be close to what you want to test, and it must be possible to manipulate it
- How many levels of the variable? The more levels, the better you can judge if there is
a linear correlation, but adding levels may force you to test more participants
Dependent variables (measured by experimenter):
- What is a good dependent variable? It has to be valid and measurable, can be
difficult, so we often settle for a variable that is measurable but further away from
what we actually want to study
- Beware of floor effects and ceiling effects (everyone scores low or high)
Control variables (controlled by experimenter):
- Holding them constant, so we don’t mix them up with our independent and
dependent variables
- Turning them into independent variables, aren’t you able to control them?
Manipulate them

,Between-subjects versus within-subjects designs
Between-subjects designs (independent groups): every subject experiences only one level of
the independent variable: random assignment, but this only works with large samples (often
about 2 groups of 100, but for sure in 2 groups of 1000). Within-subject designs (repeated
measures): every subject experiences every level (don’t let some participants experience a
few levels and others a few, use a real correct repeated measures design) of the
independent variable (difference in groups is easier to find with this type of a design): a
problem with this design is order effects, therefor, you have to counterbalance the orders in
order not to ruin your interpretation of the results

Problems of experimental designs
Particularly critical in clinical psychology:
- Quasi-experiments (e.g., patients vs. controls, you can’t randomly divide them)
instead of random assignment, which are nothing better than correlational studies
- External validity:
o Laboratory versus everyday life, you have to find out if this generalization is
possible
o Patients versus analogue populations, e.g., do highly anxious student
generalize to phobic patients? It may be the case, but we don’t know
- Low sample size (due to the fact that it is hard to find a large sample)  low
statistical power

Effect size and statistical power
Effect size and statistical power: why bother?
- How many participants will I probably need in my study? In order to give you a
decent change to find a significant result, if there is one
- Why do so many experiments in psychology yield non-significant results? Often the
case that you didn’t have the change to find the results, but this result may still be
there
- Why should I better not believe many of the significant results I read about? Many
published results cannot be replicated, statistical power is one of the reasons for this

What’s it all about? Two types of errors
Problems in generalizing from the small experimental sample to the population
Effect in the population
Effect in the sample Existing Not existing
Significant Power, 1 - β α – error (false
positive)
Non-significant β – error (false 1-α
negative)
Bold = what you want to happen, we are often learned to avoid the alpha error, but not the
beta error, but this is also something we should want to avoid

Effect size and statistical power: what are they?
- Effect size: how large is a difference/correlation/relationship? Often standardized, so
we know what this size means

, - Statistical power: what is the probability that this effect will be statistically significant
in an experiment?
- Situations in which this is important:
o Experiment in preparation: determine necessary sample size
o Experiment completed: determine power of the experiment
o Evaluation of published studies: are the effects for real?

Effects sizes: Cohen’s d as a simple example
- Situation in which you use d: comparing two group means by a t-test
¿
- Effect size d: ¿ mean1−mean2∨ SD ¿
- d is always positive

How large is d typically in psychology?
0.2 is seen as small, 0.5 is seen as medium and 0.8 is already seen as a large effect, means
two groups overlap considerably but the effect you found is already large

What affects power?
- Effect size: larger effects are easier to find, for small effect, you need huge samples so
you will probably not find it
- Sample size: effects are easier to find with many participants
- Alpha error: increasing the alpha error (false positive) reduces the beta error (false
negative), but this is only theoretical

Example: determining sample size
Before an experiment: comparison of two group means with a two-sided t-test. What is the
sample size of each group needed to achieve approx. power of 1 - β = .75? depends on the
strength of your effect size and how strict you are with the alpha error
- How many participants do you need in each group when: power = .75, d = .20, and p
= .01 two-sided? You would need 530 participants per group
- Increasing alpha will lead to 348 participants per group in .05 case and 270
participants in the .10 case
- What helps is investigating larger effects in medium effects from left to right you
would need respectively 87, 57, 44 participants per group
- In the large effects case, you would respectively need 35, 23, 18 participants per
group
Illustrates that it isn’t useful is to increase alpha, but you would need to increase the effect
sizes, but you usually don’t know the effect size and have to make an estimate

Some measures of effect size
- T-test: d
- ANOVA:
o f (f = d / 2)
o partial eta2 (percentage of explained variance)
- correlation: r (Pearson’s correlation coefficient)

Why are so many small studies with large effects published?

Voordelen van het kopen van samenvattingen bij Stuvia op een rij:

Verzekerd van kwaliteit door reviews

Verzekerd van kwaliteit door reviews

Stuvia-klanten hebben meer dan 700.000 samenvattingen beoordeeld. Zo weet je zeker dat je de beste documenten koopt!

Snel en makkelijk kopen

Snel en makkelijk kopen

Je betaalt supersnel en eenmalig met iDeal, creditcard of Stuvia-tegoed voor de samenvatting. Zonder lidmaatschap.

Focus op de essentie

Focus op de essentie

Samenvattingen worden geschreven voor en door anderen. Daarom zijn de samenvattingen altijd betrouwbaar en actueel. Zo kom je snel tot de kern!

Veelgestelde vragen

Wat krijg ik als ik dit document koop?

Je krijgt een PDF, die direct beschikbaar is na je aankoop. Het gekochte document is altijd, overal en oneindig toegankelijk via je profiel.

Tevredenheidsgarantie: hoe werkt dat?

Onze tevredenheidsgarantie zorgt ervoor dat je altijd een studiedocument vindt dat goed bij je past. Je vult een formulier in en onze klantenservice regelt de rest.

Van wie koop ik deze samenvatting?

Stuvia is een marktplaats, je koop dit document dus niet van ons, maar van verkoper lottemeulink1. Stuvia faciliteert de betaling aan de verkoper.

Zit ik meteen vast aan een abonnement?

Nee, je koopt alleen deze samenvatting voor €5,49. Je zit daarna nergens aan vast.

Is Stuvia te vertrouwen?

4,6 sterren op Google & Trustpilot (+1000 reviews)

Afgelopen 30 dagen zijn er 53340 samenvattingen verkocht

Opgericht in 2010, al 14 jaar dé plek om samenvattingen te kopen

Start met verkopen
€5,49
  • (0)
In winkelwagen
Toegevoegd