Practice Exam
Q2) Give a descriptive analysis of V105 (I would give part of my income if I were sure that money
was used to prevent environmental pollution).
A descriptive analysis on V105 indicates that the answers of the respondents on the statement ‘I
would give part of my income if I were sure that money was used to prevent environmental
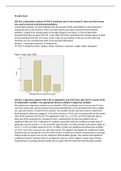
pollution’ ranged from strongly agree to strongly disagree (see figure 1). Most respondents
answered that they do agree (45.1%). More than half of the respondents do strongly agree or agree
on this statement (65.0%). The mean (2.28), mode (2) and median (2.00) are not the same and
therefore we can conclude that V105 is not normally distributed.
Analyze -> Descriptive statistics frequencies
V105 Statistics: Mean, median, mode, minimum, maximum, range; charts: histogram
Figure 1: Bar chart V105
Q3) Run a regression analysis with V105 as dependent, and V235 (Sex), Age (V237), Country (V2A)
as independent variables. Use appropriate dummy coding for categorical variables.
We performed a regression analysis to see whether V105 (I would give part of my income if I were
sure that money was used to prevent environmental pollution) can be predicted from the variables
sex, age and country. To perform this analysis the variable country has been dummy coded with
Brazil being the reference category. 2.2% of the variance in V105 can be accounted for by the model
with all the predictors (R 2=0.022). The significant F-test (F4,3510=19.921, p<0.001) indicates that at
least one of the parameters is not equal to zero, meaning that at least one predictor has an
significant effect on V105. Inspection of t-statistics associated with the coefficient reveals that all
predictors (sex (b=-0.078, t=-2.712, p=0.007), age (b=0.003, t=2.948, p=0.003) and country (Italy: b=-
0.117, t=-3.273, p=0.001) Spain (b=0.172, t=5.058, p<0.001) are significant and thus have an effect
on V105. V105 thus varies per sex, age and country. The negative and significant coefficient of Italy,
indicates that on average the score for V105 is lower in Italy than in Brazil, meaning that on average
Italian people do agree more on the statement than Brazilian people. The positive and significant
coefficient of Spain, indicates that on average the score for V105 is higher in Spain than in Brazil,
meaning that on average Spanish people do less agree with the statement than Brazilian people.


