Business Statistics 2017
2. Data Collection
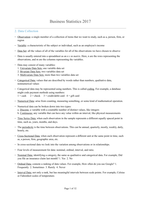
- Observation: a single member of a collection of items that we want to study, such as a, person, firm, or
region
- Variable: a characteristic of the subject or individual, such as an employee's income
- Data Set: all the values of all of the variables for all of the observations we have chosen to observe
- Data is usually entered into a spreadsheet as an n x m matrix. Here, n are the rows representing the
observations, and m are the columns representing the variables.
- Data may consist of many variables:
1. Univariate Data Sets: one variable data set
2. Bivariate Data Sets: two variables data set
3. Multivariate Data Sets: more than two variables data set
- Categorical Data: values that are described by words rather than numbers, qualitative data,
nonnumerical values
- Categorical data may be represented using numbers. This is called coding. For example, a database
might code payment methods using numbers:
1 = cash 2 = check 3 = credit/debit card 4 = gift card
- Numerical Data: arise from counting, measuring something, or some kind of mathematical operation.
- Numerical data can be broken down into two types:
a. Discrete: a variable with a countable number of distinct values, like integers
b. Continuous: any variable that can have any value within an interval, like physical measurements
- Time Series Data: when each observation in the sample represents a different equally spaced point in
time, such as, years, months, and days.
- The periodicity is the time between observations. This can be annual, quarterly, mostly, weekly, daily,
hourly, etc.
- Cross-Sectional Data: when each observation represent a different unit at the same point in time, such
as, a person, firm, geographic area, etc.
- In cross-sectional data we look into the variation among observations or in relationships.
- Four levels of measurement for data: nominal, ordinal, interval, and ratio.
- Nominal Data: identifying a category, the same as qualitative and categorical data. For example, Did
you file an insurance claim last month? 1. Yes 2. No
- Ordinal Data: connote a ranking of data values. For example, How often do you use Google? 1.
Frequently 2. Sometimes 3. Rarely 4. Never
- Interval Data: not only a rank, but has meaningful intervals between scale points. For example, Celsius
or Fahrenheit scales of temperature.
Page !1 of ! 32