Quantitative
Non-random sampling strategies
- Accidental/convenience sampling: the
Research -
researcher takes a sample of units wherever
he can find them
Quota sampling: the researcher takes a
Methodology and certain amount of units per category or
value of the selection variable
Statistics
- Volunteer sampling: the researcher asks
volunteers, usually with some specific
characteristics
- Handpicked/purposive/expert sampling: the
researcher selects who can provide the best
1.1 information to achieve the study objectives
- Chain/snowball sampling: the researcher
Research Designs:
follows up contacts mentioned by other
- Experiment: Researcher has control over respondents
factors.
Measurement levels of variables
- Cross-sectional: no manipulation of
independent variable, standardized
- Nominal: mare labels for values, no order
questionnaire used. Also large sample (e.g.
(e.g. sex)
cross section of population).
- Ordinal: ordered values with unequal steps
- Case study: In-depth study of problem. Not
(e.g. position top 10 most livable cities,
very statistic. Broad field narrowed down
educational level)
into easily researchable examples.
- Interval: ordered values with equal steps,
no natural zero (e.g. degrees Celsius, years
Random sampling strategies:
on calendar pages etc.)
- Simple random sampling - Ratio: ordered values with equal steps and
o Lottery system (e.g. fishbowl, a natural zero (e.g. degrees Kelvin, length
random number table etc.) in cm, number of children)
o From a grid on a map
Variance (s², σ²): the average deviation
- Systematic sampling
(error) from the scores to the mean. For every
o Every nth number from a list with a
score calculate the distance to the mean and
random start (e.g. from a list of the
square it (score-mean)2. Sum these squared
chamber of commerce, from a
errors and divide by number of scores -1.
telephone guide)
s² = ∑ (score – mean)² / (N – 1)
- Stratified random sampling
Standard deviation (s, σ): the average
o Operational population divided in
deviation of the data from the sample mean.
strata (sub-groups that possess
Take √ s² = s
specific characteristics)
Standard error of the mean (SE, σx̅): how
o Random sample of units taken from
well the sample mean represents the actual
each stratum, either proportionally
population mean (= std. dev. of mean). High SE
or disproportionally (bijv. 5
x is unlikely to be good estimate of µ. Estimate
groepen, total 400 sample size,
of SE by (if N>30) std. dev. of sample/√n.
dispr is 80 in elke groep en prop is
SE = s/√N
gebaseerd op hoeveel er in elke
Median: 50th percentile
groep echt zitten (%), goed voor
Quartiles: every 25th percentile (divides
small sample size)
distribution in 4 groups)
- Cluster sampling (one stage or multistage)
Quintiles: 20th (5 groups)
o Operational population
check if distribution is normal: Kolmogorov-
geographically dispersed into
Smirnov (or Shapiro-Wilk) test. If significance
clusters
level <0,05, then distribution is not normal. If
o Clusters are places where research
distribution is normal, skewness and kurtosis
units are found (e.g. schools, cities)
statistics close to 0. Check if they are
o Random selection of some clusters
significantly different from 0 by dividing through
o Random sample of research units
SE. If S / SE > 1,96 or < -1.96, then not
(e.g. 20%) taken from the selected
normal. Use Z score for normal distribution (tabA1)
clusters only
,1.2 Two-sided
e.g.
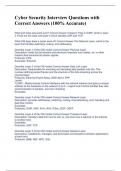
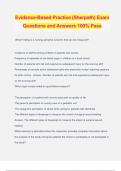
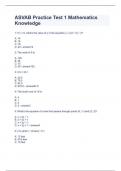
Standard normal distribution
H0: µ = µ0 (µ0 is a specific value of interest)
Total area (C = 1-Ɑ) = 1
Ha: µ µ0
Smaller portion is: P(observation ≥ z)
two sided P-value (two-tailed)
Larger portion is: P(observation ≤ z)
Reject H0 when P-value <Ɑ
Table A.1 gives areas of portion = probabilities
Also possible with rejection region (one- and
C.I. formula:
two-sided):
Use df and Ɑ. Use table A.2. to find the
rejection region. Take + and – version. Check if
estimate z t observed is within this region.
n
1.3
In practice standard deviation (σ) is unknown. Independent two sample t-test (σ1 = σ2)
Use sample data to estimate σ (s). Compare means between two groups, measures
across groups are independent.
n
(x i x )2 Standard error of µ1 - µ2:
ˆ s i 1 12 22 1 1
(n 1) Var( x1 x2 ) Var( x1 ) Var( x2 ) 2( )
n1 n2 n1 n2
SE becomes:
Information from both samples is pooled to
estimate σ by sp (std error of difference):
s
se( x )
n
C.I. becomes:
(1-a) Confidence Interval for μ1 - μ2 looks like:
s
estimate t n1;α/2
1 1
n x1 x2 tcrit s p
n1 n2
Use correct df!
One sample t-test:
Example:
x 0
t df = n1 + n2 – 2 = 48,
tcrit = t48, 0.025 ≈ t50, 0.025 =2.01
s/ n The t-test for µ 1 - µ 2 (Δ0 is a specific
known number)
One-sided:
e.g. Alternative Hypothesis:
H0: µ = µ0 versus Ha: µ > µ0 (right sided) 1-Sided: e.g. H A : 1 2 0
Right sided P-value (one-tailed) 2-Sided: H A : 1 2 0
Reject H0 when P-value <Ɑ
Null Hypothesis: H 0 : 1 2 0
Test Statistic: ( x x ) 0
t 1 2
1 1
s p
n1 n2
, Null-distribution of t is t distribution with df = n1 Se of difference:
+ n2 – 2.
C.I.
One-sided:
e.g.
H0: µ = µ0 versus Ha: µ < µ0
Left sided P-value (one-tailed)
Reject H0 when P-value <0,05 df = n – 1
Two-sided Required sample size one sample t-test
e.g.
Use formula:
H0: µ = µ0 versus Ha: µ µ0
two sided P-value (two-tailed
( zα / 2 ) 2
Reject H0 when P-value <Ɑ n
(E / )2
Check if σ1= σ2
Where E = required expected width of C.I.
Use Levene’s test from SPSS divided by 2
H0: variances are equal
Ha: variances are not equal Or use formula: Δ = μ1 – μ0
Sig <0,05 H0 is rejected
(zα zβ ) 2
Independent two sample t-test (when σ1 ≠ n (one sided alternative hypothesis)
σ2) ( / σ)2
(zα/2 zβ ) 2
Use approximate df, read from SPSS output n ( two sided alternative hypothesis)
Estimated SE is used: ( / σ)2
Required sample size paired sample t-test
( zα / 2 ) 2
TS (no sp but other formula to calculate std n
error of difference): (E / d )2
(zα zβ ) 2
n (one sided alternative hypothesis)
( / σ d ) 2
(zα/2 zβ ) 2
C.I: n ( two sided alternative hypothesis)
( / σ d ) 2
Required sample size independent two
sample t-test
Paired sample t-test ( zα / 2 ) 2
e.g. oldest of twins taller than younger at age of n2
12. Which type of tires give max acceleration on
( E / σ) 2
10 cars?
(zα zβ ) 2
Relevant sample statistics:
n2 (one sided alternative hypothesis)
( / σ)2
d (zα/2 zβ ) 2
n n 2
di d
i 1 i 1
n2
i
d d ( x1 x2 ) sd2 sd sd2 ( two sided alternative hypothesis)
n n 1 ( / σ)2
Non-random sampling strategies
- Accidental/convenience sampling: the
Research -
researcher takes a sample of units wherever
he can find them
Quota sampling: the researcher takes a
Methodology and certain amount of units per category or
value of the selection variable
Statistics
- Volunteer sampling: the researcher asks
volunteers, usually with some specific
characteristics
- Handpicked/purposive/expert sampling: the
researcher selects who can provide the best
1.1 information to achieve the study objectives
- Chain/snowball sampling: the researcher
Research Designs:
follows up contacts mentioned by other
- Experiment: Researcher has control over respondents
factors.
Measurement levels of variables
- Cross-sectional: no manipulation of
independent variable, standardized
- Nominal: mare labels for values, no order
questionnaire used. Also large sample (e.g.
(e.g. sex)
cross section of population).
- Ordinal: ordered values with unequal steps
- Case study: In-depth study of problem. Not
(e.g. position top 10 most livable cities,
very statistic. Broad field narrowed down
educational level)
into easily researchable examples.
- Interval: ordered values with equal steps,
no natural zero (e.g. degrees Celsius, years
Random sampling strategies:
on calendar pages etc.)
- Simple random sampling - Ratio: ordered values with equal steps and
o Lottery system (e.g. fishbowl, a natural zero (e.g. degrees Kelvin, length
random number table etc.) in cm, number of children)
o From a grid on a map
Variance (s², σ²): the average deviation
- Systematic sampling
(error) from the scores to the mean. For every
o Every nth number from a list with a
score calculate the distance to the mean and
random start (e.g. from a list of the
square it (score-mean)2. Sum these squared
chamber of commerce, from a
errors and divide by number of scores -1.
telephone guide)
s² = ∑ (score – mean)² / (N – 1)
- Stratified random sampling
Standard deviation (s, σ): the average
o Operational population divided in
deviation of the data from the sample mean.
strata (sub-groups that possess
Take √ s² = s
specific characteristics)
Standard error of the mean (SE, σx̅): how
o Random sample of units taken from
well the sample mean represents the actual
each stratum, either proportionally
population mean (= std. dev. of mean). High SE
or disproportionally (bijv. 5
x is unlikely to be good estimate of µ. Estimate
groepen, total 400 sample size,
of SE by (if N>30) std. dev. of sample/√n.
dispr is 80 in elke groep en prop is
SE = s/√N
gebaseerd op hoeveel er in elke
Median: 50th percentile
groep echt zitten (%), goed voor
Quartiles: every 25th percentile (divides
small sample size)
distribution in 4 groups)
- Cluster sampling (one stage or multistage)
Quintiles: 20th (5 groups)
o Operational population
check if distribution is normal: Kolmogorov-
geographically dispersed into
Smirnov (or Shapiro-Wilk) test. If significance
clusters
level <0,05, then distribution is not normal. If
o Clusters are places where research
distribution is normal, skewness and kurtosis
units are found (e.g. schools, cities)
statistics close to 0. Check if they are
o Random selection of some clusters
significantly different from 0 by dividing through
o Random sample of research units
SE. If S / SE > 1,96 or < -1.96, then not
(e.g. 20%) taken from the selected
normal. Use Z score for normal distribution (tabA1)
clusters only
,1.2 Two-sided
e.g.
Standard normal distribution
H0: µ = µ0 (µ0 is a specific value of interest)
Total area (C = 1-Ɑ) = 1
Ha: µ µ0
Smaller portion is: P(observation ≥ z)
two sided P-value (two-tailed)
Larger portion is: P(observation ≤ z)
Reject H0 when P-value <Ɑ
Table A.1 gives areas of portion = probabilities
Also possible with rejection region (one- and
C.I. formula:
two-sided):
Use df and Ɑ. Use table A.2. to find the
rejection region. Take + and – version. Check if
estimate z t observed is within this region.
n
1.3
In practice standard deviation (σ) is unknown. Independent two sample t-test (σ1 = σ2)
Use sample data to estimate σ (s). Compare means between two groups, measures
across groups are independent.
n
(x i x )2 Standard error of µ1 - µ2:
ˆ s i 1 12 22 1 1
(n 1) Var( x1 x2 ) Var( x1 ) Var( x2 ) 2( )
n1 n2 n1 n2
SE becomes:
Information from both samples is pooled to
estimate σ by sp (std error of difference):
s
se( x )
n
C.I. becomes:
(1-a) Confidence Interval for μ1 - μ2 looks like:
s
estimate t n1;α/2
1 1
n x1 x2 tcrit s p
n1 n2
Use correct df!
One sample t-test:
Example:
x 0
t df = n1 + n2 – 2 = 48,
tcrit = t48, 0.025 ≈ t50, 0.025 =2.01
s/ n The t-test for µ 1 - µ 2 (Δ0 is a specific
known number)
One-sided:
e.g. Alternative Hypothesis:
H0: µ = µ0 versus Ha: µ > µ0 (right sided) 1-Sided: e.g. H A : 1 2 0
Right sided P-value (one-tailed) 2-Sided: H A : 1 2 0
Reject H0 when P-value <Ɑ
Null Hypothesis: H 0 : 1 2 0
Test Statistic: ( x x ) 0
t 1 2
1 1
s p
n1 n2
, Null-distribution of t is t distribution with df = n1 Se of difference:
+ n2 – 2.
C.I.
One-sided:
e.g.
H0: µ = µ0 versus Ha: µ < µ0
Left sided P-value (one-tailed)
Reject H0 when P-value <0,05 df = n – 1
Two-sided Required sample size one sample t-test
e.g.
Use formula:
H0: µ = µ0 versus Ha: µ µ0
two sided P-value (two-tailed
( zα / 2 ) 2
Reject H0 when P-value <Ɑ n
(E / )2
Check if σ1= σ2
Where E = required expected width of C.I.
Use Levene’s test from SPSS divided by 2
H0: variances are equal
Ha: variances are not equal Or use formula: Δ = μ1 – μ0
Sig <0,05 H0 is rejected
(zα zβ ) 2
Independent two sample t-test (when σ1 ≠ n (one sided alternative hypothesis)
σ2) ( / σ)2
(zα/2 zβ ) 2
Use approximate df, read from SPSS output n ( two sided alternative hypothesis)
Estimated SE is used: ( / σ)2
Required sample size paired sample t-test
( zα / 2 ) 2
TS (no sp but other formula to calculate std n
error of difference): (E / d )2
(zα zβ ) 2
n (one sided alternative hypothesis)
( / σ d ) 2
(zα/2 zβ ) 2
C.I: n ( two sided alternative hypothesis)
( / σ d ) 2
Required sample size independent two
sample t-test
Paired sample t-test ( zα / 2 ) 2
e.g. oldest of twins taller than younger at age of n2
12. Which type of tires give max acceleration on
( E / σ) 2
10 cars?
(zα zβ ) 2
Relevant sample statistics:
n2 (one sided alternative hypothesis)
( / σ)2
d (zα/2 zβ ) 2
n n 2
di d
i 1 i 1
n2
i
d d ( x1 x2 ) sd2 sd sd2 ( two sided alternative hypothesis)
n n 1 ( / σ)2