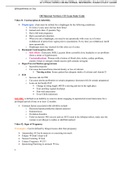
Correlations
Scatter plot: LEGACY DIALOGS > SCATTERPLOT > SIMPLE SCATTER >
select variables on X axis & Y axis
- add regression line: double click on plot > ADD FIT LINE
- add confidence/prediction interval: double click on plot >
add intervals (mean for CI or individual scores for PI)
Pearson r: ANALYZE > CORRELATE > BIVARIATE > tick “Pearson”
Spearman’s rho: ANALYZE > CORRELATE > BIVARIATE > tick “Spearman”
- for means and standard deviations: OPTIONS… > tick “Means and standard deviations”
! if they ask for r pb or phi, just use Pearson r
Regression
Regression analysis (both Simple & Multiple): ANALYZE > REGRESSION > LINEAR > select dependent &
independent variables
- STATISTICS… - for Confidence Intervals, Partial correlations
- SAVE… - for Prediction Interval, Cook’s d, Standardized Residuals, Leverage, Predicted Values
- PLOTS… - for Scatterplots (ZPRED = predicted values; ZRESID = residuals; tick “Histogram” for
histogram of standardized residuals)
! if they ask for “how much variance in Y is explained by…” ALWAYS write down R square, not R
! the F test is only for ANOVA & multiple regression analysis, if they ask if X is a significant predictor of Y, always report t value!
! when reporting variance uniquely explained, report “part” value SQUARED!
Overview of the standardized residuals (to analyze if there are any outliers): ANALYZE > DESCRIPTIVE
STATISTICS > DESCRIPTIVES > ADD “Standardized residuals”, “Leverage” and “Cook’s d”
- interpret based on outlier diagnostics
! this only works if in the regression analysis you select Cook’s d and the others from the “SAVE” tab
Hierarchical regression analysis: ANALYZE > REGRESSION > LINEAR > select dependent variable > add
predictors from the first block > NEXT > add predictor from the second block (you only need to add the
new one) > NEXT & so on
- STATISTICS… - request r square change, CI etc.
! always reset your regression before doing a new one on the same dataset, because otherwise SPSS will also give you the plots
& other stuff you asked for beforehand
- DF for testing a predictor in one of the blocks is N-p-1, but p is number of predictors in THIS model, not overall!!
Voordelen van het kopen van samenvattingen bij Stuvia op een rij:
Verzekerd van kwaliteit door reviews
Stuvia-klanten hebben meer dan 700.000 samenvattingen beoordeeld. Zo weet je zeker dat je de beste documenten koopt!
Snel en makkelijk kopen
Je betaalt supersnel en eenmalig met iDeal, creditcard of Stuvia-tegoed voor de samenvatting. Zonder lidmaatschap.
Focus op de essentie
Samenvattingen worden geschreven voor en door anderen. Daarom zijn de samenvattingen altijd betrouwbaar en actueel. Zo kom je snel tot de kern!
Veelgestelde vragen
Wat krijg ik als ik dit document koop?
Je krijgt een PDF, die direct beschikbaar is na je aankoop. Het gekochte document is altijd, overal en oneindig toegankelijk via je profiel.
Tevredenheidsgarantie: hoe werkt dat?
Onze tevredenheidsgarantie zorgt ervoor dat je altijd een studiedocument vindt dat goed bij je past. Je vult een formulier in en onze klantenservice regelt de rest.
Van wie koop ik deze samenvatting?
Stuvia is een marktplaats, je koop dit document dus niet van ons, maar van verkoper elenanicule. Stuvia faciliteert de betaling aan de verkoper.
Zit ik meteen vast aan een abonnement?
Nee, je koopt alleen deze samenvatting voor €4,69. Je zit daarna nergens aan vast.