SUMMARY STATISTICS
LECTURE 1 INTRODUCTION TO STATISTICS
Statistics:
Descriptive statistics: describe/summarize data
o Reduce the data to understandable pieces of information
o Example; what proportion of Dutch adults has a driver’s license?
o Example; what is the average delay across all train travels?
Inferential statistics: drawing inferences about populations
o Draw conclusions about populations
o Example: Are COVID-19 vaccines safe and effective in the general
population?
o Problem: we can often only make observations on a selection of cases from
a population
o Solution: inferential statistics to find out if the sample results can be
generalized to the population.
Statistical modelling: studying complex multivariate relationships
o Interested in relationships between several variables
o People differ in their scores on those variables.
o Example: to what extent does years of education predict healthy lifestyle,
controlled for income?
MEASUREMENT LEVELS
Quantitative variables: provide information about the amount of something (e.g.
height or blood pressure for each person)
Different measurement levels:
Which you can describe in words:
Categorical variables: identify group (or category) membership (e.g. male or female)
1. Nominal variables: is the same as categorical variables because serve only
names or labels for groups. It has no order, like the Netherlands, Germany, Spain
or married/divorced.
o Must be exhaustive (all possibilities are covered) and mutually exclusive
(every case fits into one category and only one)
2. Ordinal variables: knows an order, such as age: 21, 22, 23 or I don't think
anything is stupid, neutral or fun.
Example: (1=never, 2=at least 1 cigarette per month, but less than 1 per
day, 3=at least 1, but less than 5, 4= 5 or more)
Scale variable: expressed in numbers
3. Interval: is if 0 means something NO TRUE ZERO POINT
o For example it is 0 degrees Celsius = the temperature that water freezes
(so is something)
o Also IQ score
4. Ratio: is if 0 means nothing
o For example I walk 0 meters to the right = walks nothing to the right
o Length, weight or income
Both interval-level and ratio-level data are referred to as scale data: all variables are not
nominal or ordinal so they are treated as scale-level variables.
Measurement Different Ordering Differences Natural zero
level categories expressed in point
common unit
Nominal Yes
Ordinal Yes Yes
, Interval Yes Yes Yes
Ratio Yes Yes Yes Yes
Measurement levels determine the kind of statistics and statistical analyses you can
use meaningfully.
Data inspection
Every analysis starts with data inspection (getting to know your data): to make sure
you will get a clear picture of the data examining one variable at the time (univariate) or
pairs of variables (bivariate).
In general, we want to know more about:
1. Central tendency: what are the most common values?
2. Variability: how large are the differences between the subjects? Are there
extreme values in the sample?
3. Bivariate association: for each pair of variables, do they associate/covary (i.e.,
do low/large values on one variable go together with low/large values on the
other variable?)
To get a clear picture of the data, we use:
Visual data inspection (graphs)
Numerical data inspection
(statistics)
which we use depends on the measurement levels
Visual data inspection
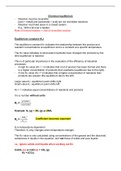
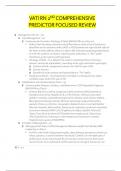
Bar charts (nominal & ordinal)
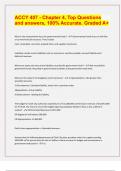
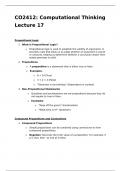
Histograms (scale)
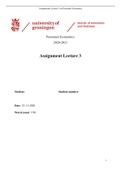
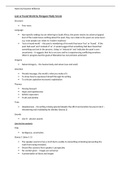
Scatterplots (scale + 2 variables)
Figure 2 Histogram
Figure 3 Bar Chart
Figure 1 Scatterplot
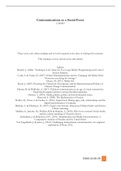
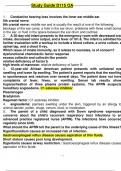
The normal distribution (Gauss curve)
Symmetrical distribution
Useful statistical properties
o Examples: IQ score, length, birthweight
NUMMERICAL DATA INSPECTION
Numerical data inspection: three common statistical approaches
Frequency tables: counts & percentages
o Nominal & ordinal data
, Central tendencies: what is the centre of scores on a variable?
o Nominal, ordinal & scale data
Variability measures: how much variation is there in variable scores?
o Ordinal & scale data
, Frequency table (1 variable)
Crosstable (2 variables)
Central tendencies
Mode: the score that is observed most frequently
For nominal, ordinal or scale data
Example:
(3, 4, 4, 5, 5, 5) => mode is 5
Median: the score that separates the higher half of data from the lower half
For ordinal or scale data that are not normally distributed
Example 1: (N = unequal): 5, 6, 7, 8, 9 => median is 7
Example 2: (N = equal): 5, 6, 8, 9 => median is 7
Mean (M): sum of all scores (∑ is the summation sign) / total number of scores
For ordinal or scale data that are normally distributed
Frequency close to 50% (cumulative percentage)
Example: 2, 3, 20 => mean is 15/3 = 5
LECTURE 1 INTRODUCTION TO STATISTICS
Statistics:
Descriptive statistics: describe/summarize data
o Reduce the data to understandable pieces of information
o Example; what proportion of Dutch adults has a driver’s license?
o Example; what is the average delay across all train travels?
Inferential statistics: drawing inferences about populations
o Draw conclusions about populations
o Example: Are COVID-19 vaccines safe and effective in the general
population?
o Problem: we can often only make observations on a selection of cases from
a population
o Solution: inferential statistics to find out if the sample results can be
generalized to the population.
Statistical modelling: studying complex multivariate relationships
o Interested in relationships between several variables
o People differ in their scores on those variables.
o Example: to what extent does years of education predict healthy lifestyle,
controlled for income?
MEASUREMENT LEVELS
Quantitative variables: provide information about the amount of something (e.g.
height or blood pressure for each person)
Different measurement levels:
Which you can describe in words:
Categorical variables: identify group (or category) membership (e.g. male or female)
1. Nominal variables: is the same as categorical variables because serve only
names or labels for groups. It has no order, like the Netherlands, Germany, Spain
or married/divorced.
o Must be exhaustive (all possibilities are covered) and mutually exclusive
(every case fits into one category and only one)
2. Ordinal variables: knows an order, such as age: 21, 22, 23 or I don't think
anything is stupid, neutral or fun.
Example: (1=never, 2=at least 1 cigarette per month, but less than 1 per
day, 3=at least 1, but less than 5, 4= 5 or more)
Scale variable: expressed in numbers
3. Interval: is if 0 means something NO TRUE ZERO POINT
o For example it is 0 degrees Celsius = the temperature that water freezes
(so is something)
o Also IQ score
4. Ratio: is if 0 means nothing
o For example I walk 0 meters to the right = walks nothing to the right
o Length, weight or income
Both interval-level and ratio-level data are referred to as scale data: all variables are not
nominal or ordinal so they are treated as scale-level variables.
Measurement Different Ordering Differences Natural zero
level categories expressed in point
common unit
Nominal Yes
Ordinal Yes Yes
, Interval Yes Yes Yes
Ratio Yes Yes Yes Yes
Measurement levels determine the kind of statistics and statistical analyses you can
use meaningfully.
Data inspection
Every analysis starts with data inspection (getting to know your data): to make sure
you will get a clear picture of the data examining one variable at the time (univariate) or
pairs of variables (bivariate).
In general, we want to know more about:
1. Central tendency: what are the most common values?
2. Variability: how large are the differences between the subjects? Are there
extreme values in the sample?
3. Bivariate association: for each pair of variables, do they associate/covary (i.e.,
do low/large values on one variable go together with low/large values on the
other variable?)
To get a clear picture of the data, we use:
Visual data inspection (graphs)
Numerical data inspection
(statistics)
which we use depends on the measurement levels
Visual data inspection
Bar charts (nominal & ordinal)
Histograms (scale)
Scatterplots (scale + 2 variables)
Figure 2 Histogram
Figure 3 Bar Chart
Figure 1 Scatterplot
The normal distribution (Gauss curve)
Symmetrical distribution
Useful statistical properties
o Examples: IQ score, length, birthweight
NUMMERICAL DATA INSPECTION
Numerical data inspection: three common statistical approaches
Frequency tables: counts & percentages
o Nominal & ordinal data
, Central tendencies: what is the centre of scores on a variable?
o Nominal, ordinal & scale data
Variability measures: how much variation is there in variable scores?
o Ordinal & scale data
, Frequency table (1 variable)
Crosstable (2 variables)
Central tendencies
Mode: the score that is observed most frequently
For nominal, ordinal or scale data
Example:
(3, 4, 4, 5, 5, 5) => mode is 5
Median: the score that separates the higher half of data from the lower half
For ordinal or scale data that are not normally distributed
Example 1: (N = unequal): 5, 6, 7, 8, 9 => median is 7
Example 2: (N = equal): 5, 6, 8, 9 => median is 7
Mean (M): sum of all scores (∑ is the summation sign) / total number of scores
For ordinal or scale data that are normally distributed
Frequency close to 50% (cumulative percentage)
Example: 2, 3, 20 => mean is 15/3 = 5