100% tevredenheidsgarantie Direct beschikbaar na je betaling Lees online óf als PDF Geen vaste maandelijkse kosten
logo-home
Summary Measurement Theory and Assessment II - EXAM PREP €6,49
In winkelwagen

Samenvatting

Summary Measurement Theory and Assessment II - EXAM PREP

1 beoordeling
 9 keer verkocht

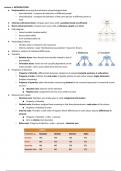
Measurement Theory and Assessment II - EXAM PREP Lecture 1. Introduction Lecture 2. Linear Regression Lecture 3. Logistic Regression  Lecture 4: Test Dimensionality               Lecture 5: Exploratory Factor Analysis (EFA) (Multiple factors) Lecture 6: Confirmatory...

[Meer zien]

Voorbeeld 3 van de 24  pagina's

  • 16 november 2023
  • 24
  • 2021/2022
  • Samenvatting
Alle documenten voor dit vak (34)

1  beoordeling

review-writer-avatar

Door: norahjimenez • 1 maand geleden

avatar-seller
bernarditarichards
‭Lecture 1. INTRODUCTION‬
‭●‬ ‭Psychometrics:‬‭assessing the attributes of psychological‬‭tests‬
‭○‬ ‭Interindividual = compare the behavior of different people‬
‭○‬ ‭Intraindividual = compare the behavior of the same person at different points in‬
‭time‬
‭●‬ ‭Criterion-referenced tests‬‭: compare each score with‬‭a‬‭predetermined‬‭cut-off point‬
‭●‬ ‭Norm-referenced tests:‬‭compare each score with a‬‭reference‬‭sample‬‭and‬‭norm‬
‭●‬ ‭Path diagram‬
‭○‬ ‭Latent variable (unobservable)‬
‭○‬ ‭Items (observable)‬
‭○‬ ‭Error (unobservable LV)‬
‭●‬ ‭Psychological theory‬
‭○‬ ‭Decides what is relevant to be measured‬
‭○‬ ‭Informs statistics: make “distributional assumptions” based on theory‬
‭●‬ ‭Statistics: analysis of individual differences‬
‭●‬ ‭Causality‬
‭○‬ ‭Relative items:‬‭item directly and causally related‬‭to the LV‬
‭(correlated)‬
‭○‬ ‭Formative items‬‭: items are not causally dependent‬‭on the‬
‭index variable - items scores determine the test score‬
‭●‬ ‭Properties of Numeral‬
‭○‬ ‭Property of identity‬‭: differentiate between categories‬‭of people (‬‭mutually‬‭exclusive‬‭&‬‭exhaustive‬‭)‬
‭○‬ ‭Property of order:‬‭indicate the‬‭rank‬‭order‬‭of people‬‭relative to each other along a‬‭single‬‭dimension‬
‭(implies transitivity)‬
‭○‬ ‭Property of quantity‬‭: adds information concerning‬‭amount‬‭to the numeral expressed in numerical counts‬
‭of units‬
‭■‬ ‭Absolute zero:‬‭absence of the attribute‬
‭■‬ ‭Relative zero:‬‭assignments of zero to an arbitrary‬‭value‬
‭●‬ ‭Measurement Levels‬
‭○‬ ‭Nominal scale‬‭: Numbers are simply ways to code‬‭categorical‬‭information‬
‭■‬ ‭Property of identity‬
‭○‬ ‭Ordinal scale:‬‭Numbers assigned have meaning in that‬‭they demonstrate a‬‭rank order‬‭of the classes‬
‭■‬ ‭Property of identity & order‬
‭○‬ ‭Interval scale‬‭: Provides a rank order of objects where‬‭differences in scale values express‬‭differences in‬
‭amount‬
‭■‬ ‭Property of identity + order + amount‬
‭■‬ ‭Zero is‬‭relative‬‭(not absolute)‬
‭○‬ ‭Ratio scale‬‭: Property of identity + order + amount‬‭+‬‭absolute zero‬

,‭Lecture 2. LINEAR REGRESSION‬
‭●‬ ‭Linear regression = conditional‬‭MEAN.‬
‭o‬ ‭Conditional mean:‬‭mean score on a variable given the‬‭score on another variable.‬
‭●‬ ‭If we have Y= b0 + b1 * x → no te olvides que es la formula predicted value!! (y=ȳ).‬
‭o‬ ‭b0 : intercept/‬‭constant‬‭: predicted value of‬‭y‬‭when‬‭x‬‭= 0.‬
‭o‬ b
‭ 1 : slope :‬‭regression coefficient‬‭: relationship‬‭between‬‭x‬‭and‬‭y‭:‬ change in‬‭y‭,‬‬
‭as‬‭x‬‭increases by 1.‬
‭o‬ ‭No error.‬
‭o‬ ‭Predicted formula and not observed one.‬
‭o‬ ‭We look at the red line instead of a gray line.‬
‭●‬ ‭Conditional mean‬‭(of y)‬ ‭= Predicted mean‬‭(of y).‬
‭●‬ ‭Notation y I x‬
‭o‬ ‭y given x.‬
‭o‬ ‭Conditional mean‬
‭●‬ ‭Assumptions‬‭distribution of y‬‭linear regression (3):‬
‭1.‬ ‭It needs to be linear regression.‬
‭2.‬ ‭y‬‭is normally distributed for all values of‬‭x‬
‭o‬ F‭ or each value of x, y needs to be normally distributed, and the mean of normal distribution‬
‭equals the predicted score of y‬
‭o‬ ‭Therefore, the‬‭predicted score of y=conditional mean.‬
‭3.‬ ‭Variation‬‭(SD)‬ ‭in scores on‬‭y‬‭is the same for all‬‭values of‬‭x‬‭.‬
‭●‬ ‭No assumptions for‬‭distribution of x.‬
‭●‬ ‭b1‬‭: represent also the difference between the scores‬‭by the two variables. Ex: differences score men and woman.‬
‭●‬ ‭Is the relationship relevant?‬‭→‬‭we need to study‬‭→‬‭R2‬‭=‬‭variance‬‭of y‬‭explained‬‭by x = measure effect‬‭size.‬
‭o‬ ‭var (y) explained variance by x=‬‭b‭1‬ ‭2‬ ‬‭* var (x)‬
‭o‬ ‭var (y) not explained variance by x‬‭=‬‭standard error‬‭of the estimate =‬‭var (e)‬
‭o‬ ‭Total variance (y)‬‭=‬ ‭b‬‭1‬‭2‬‭* var (x)‬‭+‬‭var (e)‬
‭o‬ ‭R2‬‭=‬‭b‬‭1‬‭2‬‭* var (x)‬‭/ (‬‭b‭1‬ ‬‭2‬‭* var (x)‬‭+‬‭var (e)‬‭)‬
‭●‬ ‭Psychological variables → standardize score → multiple ways to do this:‬
‭1.‬ ‭Z-score‬
‭o‬ ‭Z score - does NOT require assumption of normality (M and s)‬
‭o‬ ‭Normalize Z score (based on empirical percentile score) - requires assumption of normality.‬
‭2.‬ ‭Other distributions (t-score)‬
‭3.‬ ‭Percentile score‬
‭o‬ ‭Empirical‬
‭●‬ ‭Does not required normal distribution‬
‭●‬ F‭ rom empirical to‬‭normalize‬‭z score also possible‬‭→ assuming normal distribution from‬
‭population‬
‭●‬ ‭Based on data‬
‭●‬ ‭Theoretical‬‭(table)‬
‭ ‬ F‭ rom z-score to percentile score‬

‭●‬ ‭Normally distributed‬
‭●‬ ‭Interpreting scores‬
‭○‬ ‭Variance‬‭: how much the scores in a distribution deviate‬‭from the mean‬
‭○‬ ‭Standard deviation:‬‭square root variance‬

, ‭ ‬ S‭ kewed distribution:‬‭positive → right tail/ negative → left tail‬

‭○‬ ‭Kurtosis‬‭: positive → taller / negative → shorter‬
‭○‬ ‭Covariance‬:‭ degree of association between the‬‭variability‬‭in‬‭two‬
‭distributions‬‭(positive/ negative)‬
‭■‬ ‭Provides information about‬‭direction‬
‭○‬ ‭Correlation‬‭: Degree of association between two variables‬
‭(strong/ weak)‬
‭○‬ ‭Correlation coefficient‬‭: number of correlation - from‬‭-1‬
‭to +1‬
‭○‬ ‭Reflects‬‭magnitude‬‭: close to -1 or +1 means that the‬
‭association is very strong‬

Dit zijn jouw voordelen als je samenvattingen koopt bij Stuvia:

Bewezen kwaliteit door reviews

Bewezen kwaliteit door reviews

Studenten hebben al meer dan 850.000 samenvattingen beoordeeld. Zo weet jij zeker dat je de beste keuze maakt!

In een paar klikken geregeld

In een paar klikken geregeld

Geen gedoe — betaal gewoon eenmalig met iDeal, creditcard of je Stuvia-tegoed en je bent klaar. Geen abonnement nodig.

Direct to-the-point

Direct to-the-point

Studenten maken samenvattingen voor studenten. Dat betekent: actuele inhoud waar jij écht wat aan hebt. Geen overbodige details!

Veelgestelde vragen

Wat krijg ik als ik dit document koop?

Je krijgt een PDF, die direct beschikbaar is na je aankoop. Het gekochte document is altijd, overal en oneindig toegankelijk via je profiel.

Tevredenheidsgarantie: hoe werkt dat?

Onze tevredenheidsgarantie zorgt ervoor dat je altijd een studiedocument vindt dat goed bij je past. Je vult een formulier in en onze klantenservice regelt de rest.

Van wie koop ik deze samenvatting?

Stuvia is een marktplaats, je koop dit document dus niet van ons, maar van verkoper bernarditarichards. Stuvia faciliteert de betaling aan de verkoper.

Zit ik meteen vast aan een abonnement?

Nee, je koopt alleen deze samenvatting voor €6,49. Je zit daarna nergens aan vast.

Is Stuvia te vertrouwen?

4,6 sterren op Google & Trustpilot (+1000 reviews)

Afgelopen 30 dagen zijn er 68175 samenvattingen verkocht

Opgericht in 2010, al 15 jaar dé plek om samenvattingen te kopen

Begin nu gratis
€6,49  9x  verkocht
  • (1)
In winkelwagen
Toegevoegd