100% tevredenheidsgarantie Direct beschikbaar na betaling Zowel online als in PDF Je zit nergens aan vast
logo-home
Samenvatting: Data-Analyse €6,48
In winkelwagen

Samenvatting

Samenvatting: Data-Analyse

 4 keer verkocht

Dit is een samenvatting van het vak data-analyse. Het bestaat voornamelijk uit een samenvatting van de leerstof van de relevante hoofdstukken uit het boek. Dit is aangevuld met informatie uit de hoorcolleges en ~80% van de SPSS instructies die nodig zullen zijn.

Voorbeeld 3 van de 26  pagina's

  • Nee
  • Hoofdstuk 5, 19 t/m 24
  • 29 januari 2024
  • 26
  • 2023/2024
  • Samenvatting
book image

Titel boek:

Auteur(s):

  • Uitgave:
  • ISBN:
  • Druk:
Alle documenten voor dit vak (9)
avatar-seller
joesvanderstok
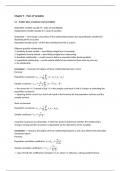
Chapter 5 – Pairs of Variables

5.1 : Scatter plot, covariance and correlation

Dependent variable (usually Y) = topic of investigation
Independent variable (usually X) = cause of variation

Scatterplot -> used to get a visual idea of the relationship between two (quantitative) variables by
displaying all the (x,y) pairs
Population/Sample cloud = all the dots resulting from the (x,y) pairs

Different possible relationships:
1. Positively linearly related -> best fitting straight line is increasing
2. Negatively linearly related -> best fitting straight line is decreasing
3. Quadratic relationship -> results seem to follow a mountain/valley based parabolic
4. Logarithmic relationship -> results variate wildly for low values but then seem to even out
5. No relationship

Covariance -> measures the degree of linear relationship between y and x
Formula:
N
1
Population covariance: σ X ,Y = ∑ (x −μ )( y −μ y )
N i =1 i x i
n
1
Sample covariance: s X ,Y = ∑ ( x −x )( y i− y )
n−1 i=1 i
-> the reason for ‘n-1’ instead of just ‘n’ in the sample covariance is that it is better at estimating the
population covariance
-> replacing all the y and Y by x and X will result in the formulas for the population variance and the
sample variance

Short cut formula:
N
1
Population covariance: σ X ,Y = ∑ x y −μ μ
N i =1 i i x y
1
Sample covariance: s X ,Y = ¿
n−1

Using the covariance has downsides. A reference point to determine whether the relationship is
strong is missing and the covariance is dependent on the dimensions of the variables

Correlation -> measures the degree of linear relationship between y and x but without the downsides
mentioned above
Formula:
σ X ,Y
Population correlation coefficient: ρ=ρ X , Y =
σ X σY
SX , Y
Sample correlation coefficient: r =r X , Y =
SX SY
-> value of both the coefficients is between (-1,1), where +1 indicates a strong positively linear

,relationship, -1 a strong negatively linear relationship and 0 no relationship (uncorrelated)

5.2 : Regression line

Regression of Y on X = the study of the dependence of Y on X
Least squares (LS) method :
1. Start with a general line with the equation: y = a + bx
2. Fill in the x and find out what values of a and b cause the least overall difference for the y values

Formulas:
S X, Y
Sample regression coefficients: b = 2 and a = y−b x
SX
S X, Y
Population regression coefficients: β 1= 2 and β 0=μ y −β 1 μ x
SX

Sample regression line: ^y =b0 +b1 x (also called: prediction line)
Population regression line: y=β 0 + β 1 x
-> b0/ꟗ0 = the intercept
-> b1/ꟗ1 = the slope
-> sample regression line passes through ( x , y )
-> population regression line passes through ( μ x , μ y )

Interpolation = if a new ‘x’ value is within the range of existing ‘x’ values, predictions can be trusted
Extrapolation = if a new ‘x’ value is outside the range of existing ‘x’ values, predictions can’t be
trusted

Residuals/Errors = the difference between the y-values and the regression line
-> shows the concentration of y-values around the regression line
-> the sum of residuals will always be 0 (otherwise the regression line is not the best fitting line)

Formulas:
Residual/Error: e i= y i− ^yi
n n
Sum of squared errors: SSE=∑ ( y i− ^y i ) =∑ e i
2 2

i=1 i=1
-> the smaller the SSE, the better the predicting performance of the regression line

5.3 : Linear transformations

Transforming a variable ‘X’ can be done using the formula: Y = a + bX
-> this has implications for certain statistics, summarised below:


Population dataset Sample dataset
Location μ y =a+b μ x y=a+b x
μ ymedian =a+b μ xmedian y median =a+ b x median
2 2 2 2 2 2
Variation σ Y =b σ X sY =b s X
σ Y =|b|σ X sY =|b|s X

, Transforming both variables ‘X’ and ‘Y’ can be using two formulas: V = a + bX and W = c + dY
-> this has implications for certain statistics, summarised below:


Population dataset Sample dataset
Covariance σ V ,W =bd σ X ,Y sV , W =bd s X ,Y
Correlation coefficient If bd >0 : ρV , W = ρX ,Y r V ,W =r X , Y
If bd <0 : ρV , W =− ρX , Y r V ,W =−r X , Y

5.4 : Relationship between two qualitative variables

Covariance and correlation coefficient are useless when comparing two qualitative variables
-> instead we use contingency/cross-classification tables, they give the joint frequencies of the data

Voordelen van het kopen van samenvattingen bij Stuvia op een rij:

Verzekerd van kwaliteit door reviews

Verzekerd van kwaliteit door reviews

Stuvia-klanten hebben meer dan 700.000 samenvattingen beoordeeld. Zo weet je zeker dat je de beste documenten koopt!

Snel en makkelijk kopen

Snel en makkelijk kopen

Je betaalt supersnel en eenmalig met iDeal, creditcard of Stuvia-tegoed voor de samenvatting. Zonder lidmaatschap.

Focus op de essentie

Focus op de essentie

Samenvattingen worden geschreven voor en door anderen. Daarom zijn de samenvattingen altijd betrouwbaar en actueel. Zo kom je snel tot de kern!

Veelgestelde vragen

Wat krijg ik als ik dit document koop?

Je krijgt een PDF, die direct beschikbaar is na je aankoop. Het gekochte document is altijd, overal en oneindig toegankelijk via je profiel.

Tevredenheidsgarantie: hoe werkt dat?

Onze tevredenheidsgarantie zorgt ervoor dat je altijd een studiedocument vindt dat goed bij je past. Je vult een formulier in en onze klantenservice regelt de rest.

Van wie koop ik deze samenvatting?

Stuvia is een marktplaats, je koop dit document dus niet van ons, maar van verkoper joesvanderstok. Stuvia faciliteert de betaling aan de verkoper.

Zit ik meteen vast aan een abonnement?

Nee, je koopt alleen deze samenvatting voor €6,48. Je zit daarna nergens aan vast.

Is Stuvia te vertrouwen?

4,6 sterren op Google & Trustpilot (+1000 reviews)

Afgelopen 30 dagen zijn er 62774 samenvattingen verkocht

Opgericht in 2010, al 15 jaar dé plek om samenvattingen te kopen

Start met verkopen
€6,48  4x  verkocht
  • (0)
In winkelwagen
Toegevoegd