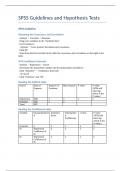
The document is an SPSS guideline on obtaining the covariance, correlation, confidence intervals, reading the ANOVA table, the coefficients table, interaction terms, dummy variables, and testing the model assumptions. Additionally, I provided a summary of when to use what test and when to reject th...
SPSS Guidelines and Hypothesis Tests
SPSS Guideline
Obtaining the Covariance and Correlation
- Analyze → Correlate → Bivariate
- Drag your variables in the "Variables Box"
- For Covariance:
- Options → Cross-product deviations and covariance
- Click OK
- Read from the first variable in the table the covariance and correlation on the right in the
table
95% Confidence Intervals
- Analyze → Regression → Linear
- Determine the dependent variable and the independent variable(s)
- Click "Statistics" → "Confidence Intervals"
- Set Level
- Click "Continue" and "Ok"
Reading the ANOVA table
Source Sum of Degrees of Mean Square F-value P-value
Squares Freedom (SPSS will
state Sig.
which is the
P-value)
Regression SSR x x x x
Residual SSE x x
Total SST
Reading the Coefficients table
Variable Unstandardized Standard Standardize t-value P-value
B Error d (SPSS will
Coefficients state Sig.
which is the
P-value)
Constant x x x x x
B₁ Regression x x x x
Coefficient of
B₁
B₂ Regression x x x x
Coefficient of
B₂
, Prediction Intervals and Confidence Intervals
- For a certain value of a variable
- Type the value of the variable under the last observation
- Analyze → Regression → Linear → Determine variables
- Click "Save" and
- Tick "Unstandardized" under "Predicted Values"
- Tick "Mean" and "Individual" under "Prediction intervals"
- Set CI to 95%
- Click "Continue" and "Ok" In data view you can see the interval
Definitions:
Mean Confidence Interval = LMCI and UMCI
Individual Confidence Interval = LICI and UICI
Directly Finding the Partial F-Test Statistic Value
- Analyze → Regression → Linear
- Determine the dependent variable and the independent variable(s) of the full model
- Click "Next"
- Drag the variables which are not in the reduced model in "Block 2 of 2"
- Select as method "Remove"
- Click "Statistics" → Tick "R squared change"
Model 1 = Full Model and Model 2 = Reduced Model
Squared and Interaction Terms
For Square Term:
- Transform → Compute Variable → Name Variable
- Numeric Expression type: Variable₁ * Variable₁
For Interaction Term:
- Transform → Compute Variable → Name Variable
- Numeric Expression type: Variable₁ * Variable₂
Voordelen van het kopen van samenvattingen bij Stuvia op een rij:
Verzekerd van kwaliteit door reviews
Stuvia-klanten hebben meer dan 700.000 samenvattingen beoordeeld. Zo weet je zeker dat je de beste documenten koopt!
Snel en makkelijk kopen
Je betaalt supersnel en eenmalig met iDeal, creditcard of Stuvia-tegoed voor de samenvatting. Zonder lidmaatschap.
Focus op de essentie
Samenvattingen worden geschreven voor en door anderen. Daarom zijn de samenvattingen altijd betrouwbaar en actueel. Zo kom je snel tot de kern!
Veelgestelde vragen
Wat krijg ik als ik dit document koop?
Je krijgt een PDF, die direct beschikbaar is na je aankoop. Het gekochte document is altijd, overal en oneindig toegankelijk via je profiel.
Tevredenheidsgarantie: hoe werkt dat?
Onze tevredenheidsgarantie zorgt ervoor dat je altijd een studiedocument vindt dat goed bij je past. Je vult een formulier in en onze klantenservice regelt de rest.
Van wie koop ik deze samenvatting?
Stuvia is een marktplaats, je koop dit document dus niet van ons, maar van verkoper maxgoossens. Stuvia faciliteert de betaling aan de verkoper.
Zit ik meteen vast aan een abonnement?
Nee, je koopt alleen deze samenvatting voor €5,57. Je zit daarna nergens aan vast.